


Documentation often sits on the back burner, treated as a necessary evil rather than a strategic asset. However, well-crafted Unified Modeling Language (UML) diagrams bridge the gap between abstract ideas and concrete implementation. They serve as a universal visual language that aligns developers, stakeholders, and product managers around a shared understanding of system architecture. This guide explores how to build documentation that adds value, reduces confusion, and stands the test of time.
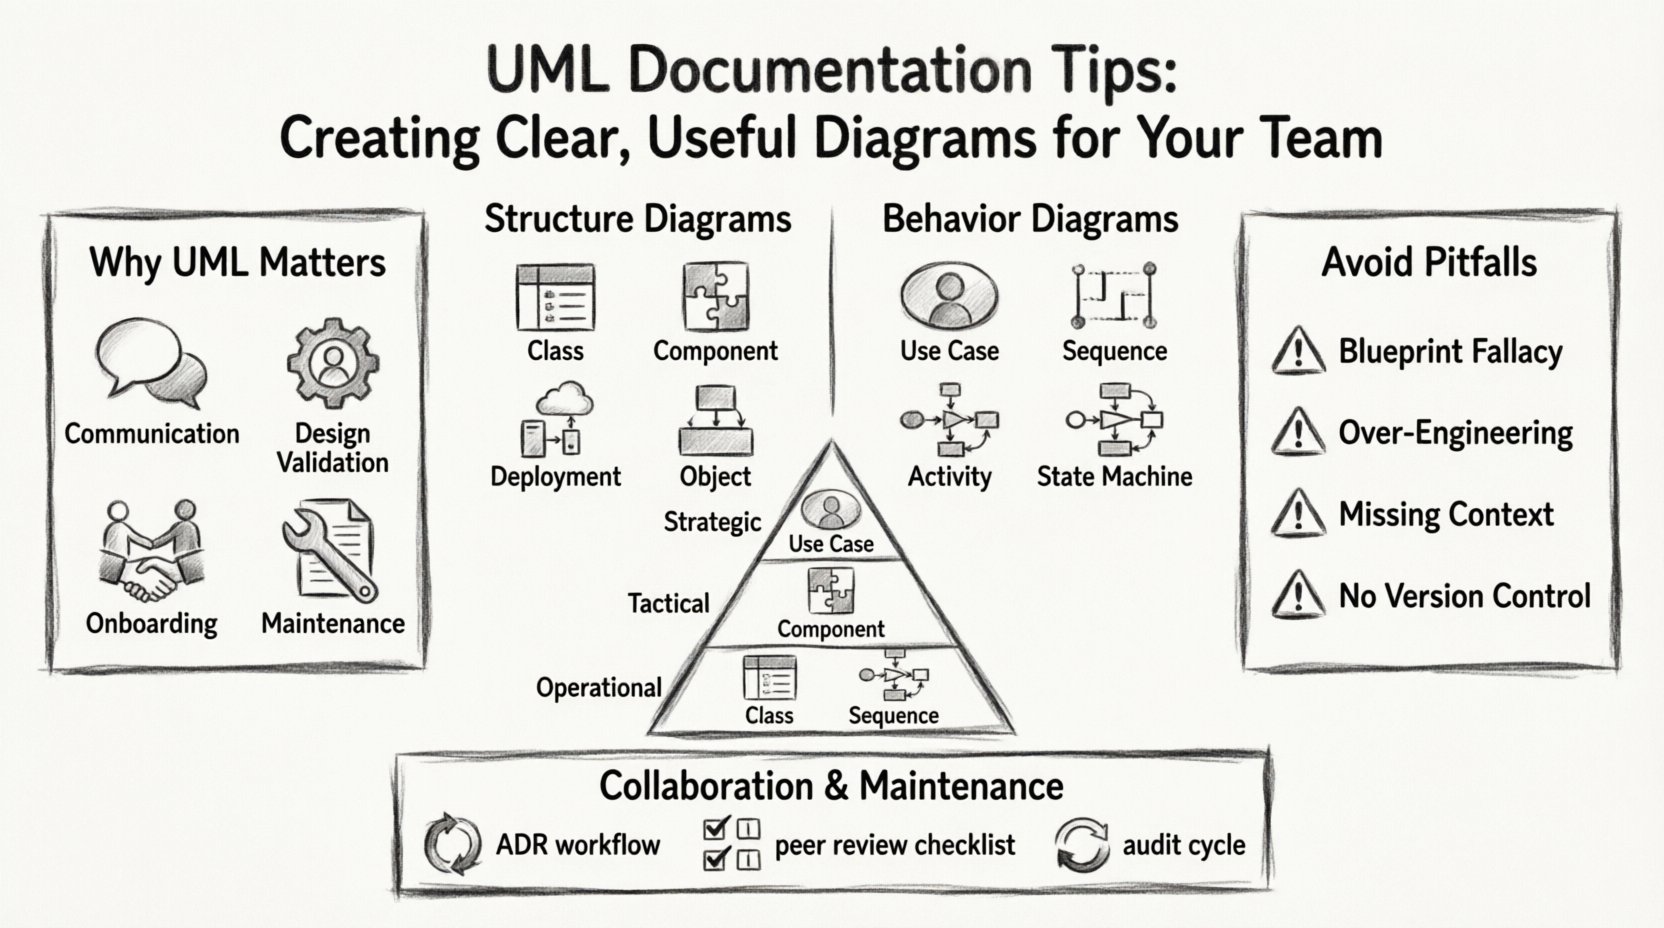
Why UML Matters in Modern Development 🏗️
Software systems are becoming increasingly complex. Microservices, distributed databases, and asynchronous workflows introduce layers of difficulty that text-based specifications alone struggle to convey. UML provides a standardized set of notations to represent these complexities visually. When used correctly, it transforms vague requirements into precise models.
- Communication: Reduces ambiguity between technical and non-technical team members.
- Design Validation: Allows architects to spot logical errors before writing a single line of code.
- Onboarding: New engineers can grasp the system landscape much faster with visual aids.
- Maintenance: Clear diagrams make it easier to understand legacy code during refactoring.
The goal is not to create art, but to create utility. A diagram that sits in a repository and is never updated is worse than no diagram at all. The focus must remain on clarity and relevance.
Understanding the Core Categories of UML 🧩
UML is vast. Attempting to use every diagram type in every project leads to clutter. The first step in creating useful documentation is knowing which tool fits the job. UML diagrams generally fall into two main categories: Structure and Behavior.
1. Structure Diagrams
These diagrams describe the static aspect of the system. They define the components that make up the system and how they relate to one another.
- Class Diagram: The backbone of object-oriented design. It shows classes, attributes, methods, and relationships (inheritance, association, aggregation).
- Component Diagram: High-level view of physical or logical components and their interfaces. Useful for showing how major subsystems interact.
- Deployment Diagram: Illustrates the hardware topology. It shows where software artifacts run, such as servers, databases, and network devices.
- Object Diagram: A snapshot of the system at a specific moment in time. It is less common but useful for debugging specific states.
2. Behavior Diagrams
These diagrams capture the dynamic aspects of the system. They describe how the system behaves over time and in response to events.
- Use Case Diagram: Shows the interactions between actors (users or external systems) and the system itself. It defines the scope of functionality.
- Sequence Diagram: Focuses on time. It details the order of messages passed between objects to achieve a specific goal.
- Activity Diagram: Similar to a flowchart. It maps out the flow of control from activity to activity.
- State Machine Diagram: Describes the different states an object can be in and the transitions triggered by events.
Designing for Clarity: Best Practices 🎨
Creating a diagram is easy; creating one that communicates effectively is harder. Here are the principles to follow when drafting your documentation.
Know Your Audience
A diagram meant for senior architects looks different from one meant for new junior developers. You must tailor the level of detail accordingly.
- For Architects: Focus on high-level boundaries, integration points, and data flow. Avoid getting bogged down in method-level details.
- For Developers: Include class relationships, data types, and specific interaction flows. Precision is key here.
- For Stakeholders: Stick to Use Case diagrams. Keep technical jargon to a minimum. Focus on features and user value.
Consistency is King
Inconsistency breeds confusion. If you use a specific notation for a database in one diagram, do not switch to a different icon in the next. Establish a style guide for your team.
- Iconography: Define standard shapes for entities, processes, and external systems.
- Color Coding: Use colors sparingly. For example, reserve red only for critical errors or dependencies that are deprecated.
- Naming Conventions: Ensure labels are descriptive and consistent. Use camelCase for internal classes and Title Case for external actors.
Abstraction and Layering
Do not try to fit the entire system onto a single page. Break complex systems into logical layers. A high-level overview should exist alongside detailed sub-diagrams. This allows readers to zoom in only when necessary.
| Layer Level | Focus | Example Diagram |
|---|---|---|
| Strategic | Business goals, high-level scope | Use Case Diagram |
| Tactical | System modules, service boundaries | Component Diagram |
| Operational | Class details, message flow | Class & Sequence Diagrams |
Avoiding Common Pitfalls ⚠️
Even experienced engineers fall into traps when documenting. These mistakes can turn a helpful guide into a source of frustration.
1. The “Blueprint” Fallacy
Many teams treat UML diagrams as a final blueprint that must be 100% accurate at all times. In agile environments, code changes frequently. Trying to keep a diagram perfectly synchronized with every commit leads to burnout.
- Solution: Treat diagrams as living documentation. Update them when significant architectural changes occur, not after every bug fix.
- Solution: Focus on the “why” and “how” of the architecture rather than exact method signatures.
2. Over-Engineering the Model
Using complex inheritance hierarchies or detailed state machines for simple flows adds noise without value. If a process is linear, a flowchart is sufficient. Do not use a State Machine diagram for a simple “Submit Form” action.
- Solution: Ask yourself: “Does this diagram help me solve a problem?” If the answer is no, simplify or remove it.
3. Ignoring the “So What?”
Diagrams should explain relationships, not just list items. A Class Diagram that lists attributes without showing associations tells you nothing about how data flows.
- Solution: Always annotate relationships. Use labels like “1-to-many” or “depends on” to clarify connections.
4. Lack of Version Control
If your diagrams are stored in a Word document or an image folder, they become unmanageable. They need to be versioned alongside your code.
- Solution: Store diagram files in the same repository as your source code. This ensures that when code moves, the documentation moves with it.
Collaboration and Review Processes 🤝
Documentation is a team sport. A diagram created in isolation often misses critical context or misunderstands business rules. Integrating diagram creation into your workflow ensures accuracy and buy-in.
1. The Architecture Decision Record (ADR)
Link your diagrams to your architectural decisions. When a major change is proposed, document the reasoning in an ADR and attach the relevant UML diagrams as evidence.
- Context: Why are we making this change?
- Decision: What is the chosen path?
- Consequences: What does the diagram show regarding impact?
2. Peer Review of Diagrams
Just as you review code, review diagrams. A fresh pair of eyes can spot a broken link or a confusing label that the creator missed.
- Check for Clarity: Can a new hire understand this flow in 5 minutes?
- Check for Completeness: Are all edge cases represented?
- Check for Consistency: Does this match the existing style guide?
3. Feedback Loops
Encourage developers to suggest updates. If a developer finds a diagram misleading while implementing a feature, they should be empowered to update it immediately.
- Empowerment: Make it easy to edit diagrams.
- Incentive: Recognize contributions to documentation as much as code contributions.
Maintaining Documentation Over Time 🔄
The biggest threat to UML documentation is obsolescence. Systems evolve, requirements shift, and old diagrams become myths. Here is how to keep your documentation relevant.
1. Schedule Regular Audits
Set a recurring reminder to review critical diagrams. Quarterly is often a good balance between stability and currency.
- Verify Accuracy: Does the diagram match the current codebase?
- Archive Old Versions: Keep historical diagrams for context, but mark them clearly as deprecated.
- Update References: Ensure links in your documentation point to the current versions.
2. Automate Where Possible
While manual drawing is common, some tools can generate diagrams from code. This reduces the gap between reality and documentation. However, be cautious; generated diagrams can be too detailed and hard to read. Use them for reference, not necessarily as the primary communication tool.
3. Integrate with Knowledge Bases
Don’t hide diagrams in a subfolder. Embed them in your team’s knowledge base or wiki. Contextualize them with text explanations so readers understand the purpose before looking at the visual.
| Documentation State | Impact on Team | Action Required |
|---|---|---|
| Accurate & Current | High confidence, fast onboarding | Maintain standard review cycle |
| Outdated | Confusion, wasted time debugging | Update immediately or archive |
| Missing | Knowledge silos, dependency on individuals | Prioritize creation for critical paths |
Specific Tips for Key Diagram Types 💡
While general principles apply to all UML, specific diagram types require unique attention.
Sequence Diagrams
These can get messy quickly with many participants. Keep them focused on one specific scenario (e.g., “User Login”) rather than trying to show the entire login flow in one go.
- Use Frames: Group related interactions using frames for loops or conditionals.
- Limit Participants: If there are more than 10 objects, consider breaking the flow into multiple diagrams.
- Highlight Critical Paths: Use bold lines or colors for the happy path, and dashed lines for error handling.
Class Diagrams
It is tempting to include every method. Resist this urge.
- Public vs. Private: Show public interfaces clearly. Hide private implementation details unless they are crucial for understanding inheritance.
- Interfaces: Use interfaces to show contracts without revealing implementation logic.
- Annotations: Add notes to explain complex constraints or business rules attached to classes.
Activity Diagrams
These act as flowcharts. Ensure the logic is easy to follow.
- Swimlanes: Use swimlanes to show which actor or system is responsible for each step.
- Decision Points: Make sure decision diamonds are labeled clearly (e.g., “Valid Input? Yes/No”).
- Start/End: Always mark the start and end nodes to prevent ambiguity about flow direction.
Conclusion on Documentation Culture 🚀
Building clear UML documentation is not just about drawing shapes. It is about fostering a culture of clarity and shared understanding. When your team invests time in creating useful diagrams, you invest in the longevity and health of your software projects. By following these guidelines, avoiding common traps, and maintaining a collaborative approach, you ensure that your documentation serves its true purpose: enabling your team to build better systems together.
Remember, the best diagram is the one that gets used. Prioritize utility over perfection, and ensure your visual assets evolve alongside your code. This approach leads to sustainable engineering practices and a more resilient team.

