


Unified Modeling Language (UML) serves as the universal blueprint for software architecture. For computer science students, understanding these diagrams is not merely an academic exercise; it is a fundamental skill for bridging the gap between abstract logic and concrete implementation. This guide provides a structured pathway through the core concepts, ensuring you build a solid foundation in system design.
🎯 Why Learn UML?
Software development involves complex interactions between data, logic, and users. Without a standardized notation, communication breaks down between stakeholders, developers, and testers. UML offers a standardized way to visualize, specify, construct, and document the artifacts of a software system.
- Communication: Provides a common language for teams.
- Visualization: Transforms complex code structures into readable diagrams.
- Documentation: Creates a lasting record of system design.
- Analysis: Helps identify design flaws before coding begins.
📐 Prerequisites for Success
Before diving into specific diagrams, certain foundational concepts must be clear. UML is deeply intertwined with Object-Oriented Programming (OOP) principles.
Core Concepts to Review
- Classes and Objects: Understand the distinction between a blueprint (class) and an instance (object).
- Attributes and Methods: Know how data and behavior are encapsulated.
- Inheritance: Grasp how classes relate through parent-child hierarchies.
- Polymorphism: Understand how objects can be treated as instances of their parent class.
- Encapsulation: Recognize the separation of interface and implementation.
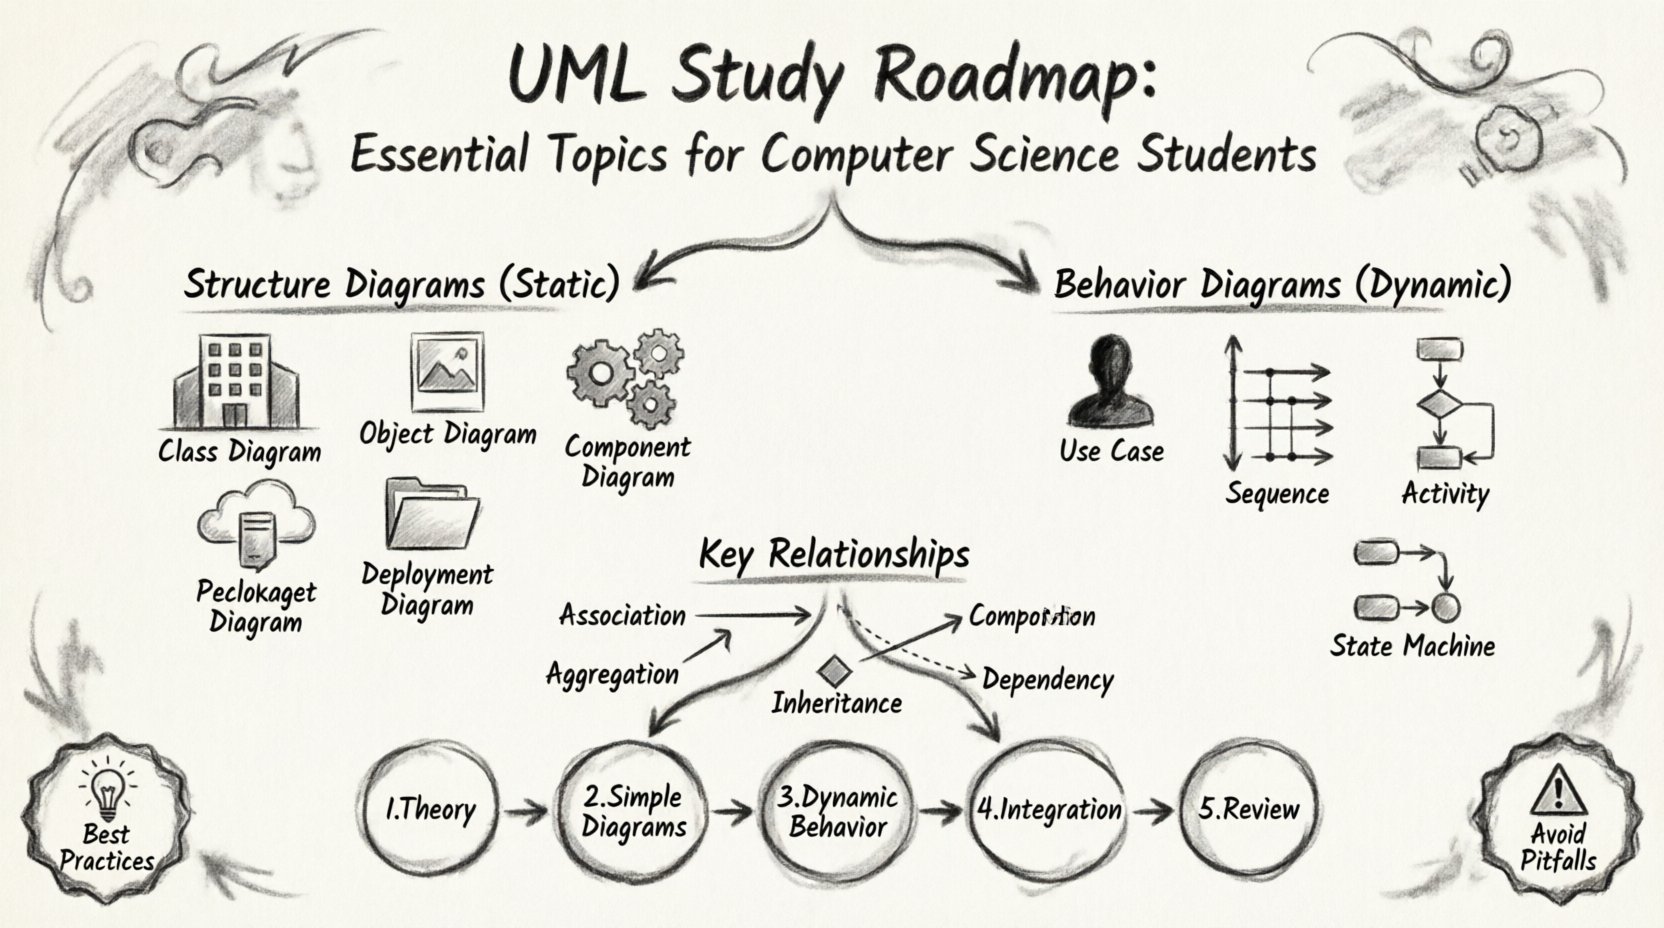
🏗️ Structure Diagrams: The Skeleton of the System
Structure diagrams describe the static part of a system. They show what the system is composed of, including classes, objects, components, and nodes. These diagrams define the architecture.
1. Class Diagrams 🏛️
The Class Diagram is the most used diagram in UML. It describes the static structure of a system by showing its classes, attributes, operations, and relationships.
- Classes: Represented as rectangles divided into three sections: name, attributes, and operations.
- Attributes: Data properties associated with the class (e.g.,
private int age). - Operations: Methods or functions the class can perform (e.g.,
public void login()). - Visibility: Indicated by symbols:
+for public,-for private,#for protected.
2. Object Diagrams 🖼️
Object diagrams represent a snapshot of the system at a specific moment in time. They are instances of class diagrams.
- Instances: Show specific objects rather than generic classes.
- Links: Show connections between specific instances.
- Use Case: Useful for validating class diagrams or documenting specific scenarios.
3. Component Diagrams ⚙️
Component diagrams describe the organization and dependencies between software components. They are crucial for understanding the physical implementation.
- Components: Represent modular parts of the system (e.g., libraries, executables).
- Interfaces: Show how components interact via provided or required interfaces.
- Dependencies: Indicate how one component relies on another.
4. Deployment Diagrams 🌐
Deployment diagrams map the physical hardware and software architecture. They show where software artifacts are deployed.
- Nodes: Represent physical hardware (servers, workstations, devices).
- Artifacts: Show the software running on the nodes (executables, databases).
- Connectors: Represent communication paths between nodes (networks, buses).
5. Package Diagrams 📦
Package diagrams organize elements into groups. They help manage complexity in large systems.
- Namespaces: Prevent naming conflicts by grouping related elements.
- Dependencies: Show relationships between packages.
- Organization: Essential for maintaining large codebases.
🔄 Behavior Diagrams: The Life of the System
Behavior diagrams describe the dynamic aspects of the system. They focus on how the system behaves and changes over time.
1. Use Case Diagrams 🎭
Use case diagrams capture the functional requirements of a system. They show interactions between actors and the system.
- Actors: Represent users or external systems interacting with the application.
- Use Cases: Represent specific functionalities or goals.
- Relationships: Include associations, generalizations, and includes/extends.
2. Sequence Diagrams 📉
Sequence diagrams show how objects interact over time. They are essential for understanding message passing.
- Lifelines: Vertical lines representing objects over time.
- Messages: Arrows showing communication between objects.
- Activation Bars: Show when an object is performing an action.
- Focus of Control: Indicates which object is currently active.
3. Activity Diagrams 🎬
Activity diagrams model the flow of control from activity to activity. They are similar to flowcharts.
- Actions: Represent specific steps in a process.
- Transitions: Show the flow from one action to another.
- Decision Nodes: Diamond shapes representing conditional logic (if/else).
- Forks and Joins: Represent concurrent activities (parallel processing).
4. State Machine Diagrams 🔋
State machine diagrams describe the lifecycle of an object. They show how an object responds to events.
- States: Represent conditions during the lifecycle (e.g., Idle, Running, Error).
- Transitions: Arrows connecting states, labeled with events that trigger the change.
- Events: Triggers that cause a transition.
- Initial and Final States: Mark the beginning and end of the lifecycle.
🔗 Understanding Relationships
Relationships define how elements in a diagram connect. Misusing relationships leads to confusing models.
Association
A structural relationship that describes a link between objects. It can be unidirectional or bidirectional.
Aggregation
A “has-a” relationship where the child can exist independently of the parent. It is a weak form of ownership.
Composition
A strong form of ownership. If the parent is destroyed, the child is also destroyed. They share the same lifecycle.
Inheritance (Generalization)
Represents an “is-a” relationship. The child class inherits properties and behaviors from the parent class.
Dependency
A relationship where a change in one element may affect another. It is a weaker link than association.
📊 Diagram Type Comparison
| Diagram Type | Category | Primary Focus | Common Use |
|---|---|---|---|
| Class Diagram | Structure | Static Structure | Designing data models |
| Sequence Diagram | Behavior | Interaction | API design, logic flow |
| Use Case Diagram | Behavior | Requirements | System boundaries, users |
| State Machine Diagram | Behavior | State Changes | Workflow, state logic |
| Deployment Diagram | Structure | Hardware | Infrastructure setup |
| Activity Diagram | Behavior | Process Flow | Business processes |
🛠️ Best Practices for Modeling
Creating a diagram is one thing; creating a useful one is another. Follow these guidelines to ensure clarity and utility.
- Keep it Simple: Avoid clutter. If a diagram becomes too complex, split it into multiple views.
- Consistent Notation: Stick to UML standards. Do not invent custom symbols.
- Focus on Audience: A diagram for developers looks different from one for stakeholders.
- Iterate: Models evolve as the system evolves. Update diagrams regularly.
- Use White Space: Space out elements to improve readability.
- Label Clearly: Ensure all lines, nodes, and arrows have descriptive labels.
⚠️ Common Pitfalls to Avoid
Even experienced designers make mistakes. Being aware of common errors can save significant time during the design phase.
- Over-Modeling: Creating detailed diagrams for every minor feature slows down development.
- Under-Modeling: Skipping design leads to technical debt and refactoring nightmares.
- Ignoring Constraints: Failing to note cardinality (e.g., one-to-many) limits the model’s accuracy.
- Mixing Layers: Do not mix business logic with database logic in the same diagram.
- Static vs. Dynamic: Ensure you are using the correct diagram type for the behavior you want to show.
🚀 Integrating UML into Projects
Applying UML in a real-world scenario requires discipline. It is not enough to know the diagrams; you must know when to use them.
Phase 1: Analysis
Use Use Case diagrams to gather requirements. Define who the users are and what the system must do. This sets the scope.
Phase 2: Design
Create Class diagrams to define the data structure. Use Sequence diagrams to map out critical workflows. This phase ensures the logic holds up.
Phase 3: Implementation
Refer to Class diagrams during coding. Use Activity diagrams to debug complex logic flows. Keep the code aligned with the design.
Phase 4: Maintenance
Update diagrams when requirements change. If the system evolves, the blueprint must reflect the new reality.
📚 Deep Dive: Advanced Concepts
As you progress, you will encounter more specialized diagrams and patterns.
Timing Diagrams ⏱️
These focus on the timing constraints of signals. They are critical for real-time systems where milliseconds matter.
- Time Axis: Horizontal line representing time.
- Signals: Events that occur at specific points in time.
- Lifelines: Show the state of objects over the time axis.
Communication Diagrams 💬
Similar to sequence diagrams but focus on object relationships rather than time. They show the structural organization of objects.
- Links: Show connections between objects clearly.
- Sequence Numbers: Indicate the order of messages.
- Flexibility: Good for showing high-level object interactions.
Interaction Overview Diagrams 🗺️
A high-level view that combines activity and sequence diagrams. It shows the flow of control between interaction diagrams.
- Nodes: Represent interaction diagrams.
- Flow: Shows the sequence of interactions.
- Complexity: Used for very large, complex systems.
🎓 Learning Path Recommendations
Building proficiency requires a structured approach. Follow this sequence to maximize retention and understanding.
Step 1: Theory
Read official specifications and standard texts. Understand the rules before drawing. Focus on semantics.
Step 2: Simple Diagrams
Start with Class and Use Case diagrams. These form the backbone of most projects. Practice drawing them by hand first.
Step 3: Dynamic Behavior
Move to Sequence and Activity diagrams. Practice mapping out logic flows. Ensure you understand message passing.
Step 4: Integration
Create a full model for a small project. Connect structure diagrams with behavior diagrams. Verify consistency.
Step 5: Review
Get feedback from peers. A fresh pair of eyes often spots inconsistencies that you miss.
🔍 Tools and Resources
While the focus is on concepts, utilizing the right environment helps practice. General modeling tools allow you to experiment without commitment.
- IDE Plugins: Many development environments include basic diagramming capabilities.
- Open Source Tools: Look for community-driven projects that support UML standards.
- Text-Based Diagrams: Some tools allow defining diagrams using text, which is great for version control.
- Documentation: Keep your diagrams alongside your code documentation.
🧠 Final Thoughts on System Design
UML is a tool, not a goal. The value lies in the clarity it brings to complex problems. By mastering these diagrams, you gain the ability to think structurally and logically. This skill transfers beyond code into any system you design.
Remember that diagrams are living documents. They serve as a contract between the designer and the builder. Treat them with the respect they deserve. A well-documented system is easier to maintain, extend, and understand by others.
Start with the basics. Practice consistently. Apply the concepts to real projects. Over time, the diagrams will become second nature, allowing you to focus on the logic rather than the notation.

