


In the complex landscape of software architecture, visualizing how systems interact with physical hardware is crucial. A deployment diagram provides the blueprint for the runtime environment where software components actually reside. This guide explores the fundamental concepts, structural elements, and practical applications of these diagrams within the Unified Modeling Language (UML) standard. By mastering the visual representation of infrastructure, architects can ensure that software solutions are robust, scalable, and aligned with physical constraints.
🔍 What is a Deployment Diagram?
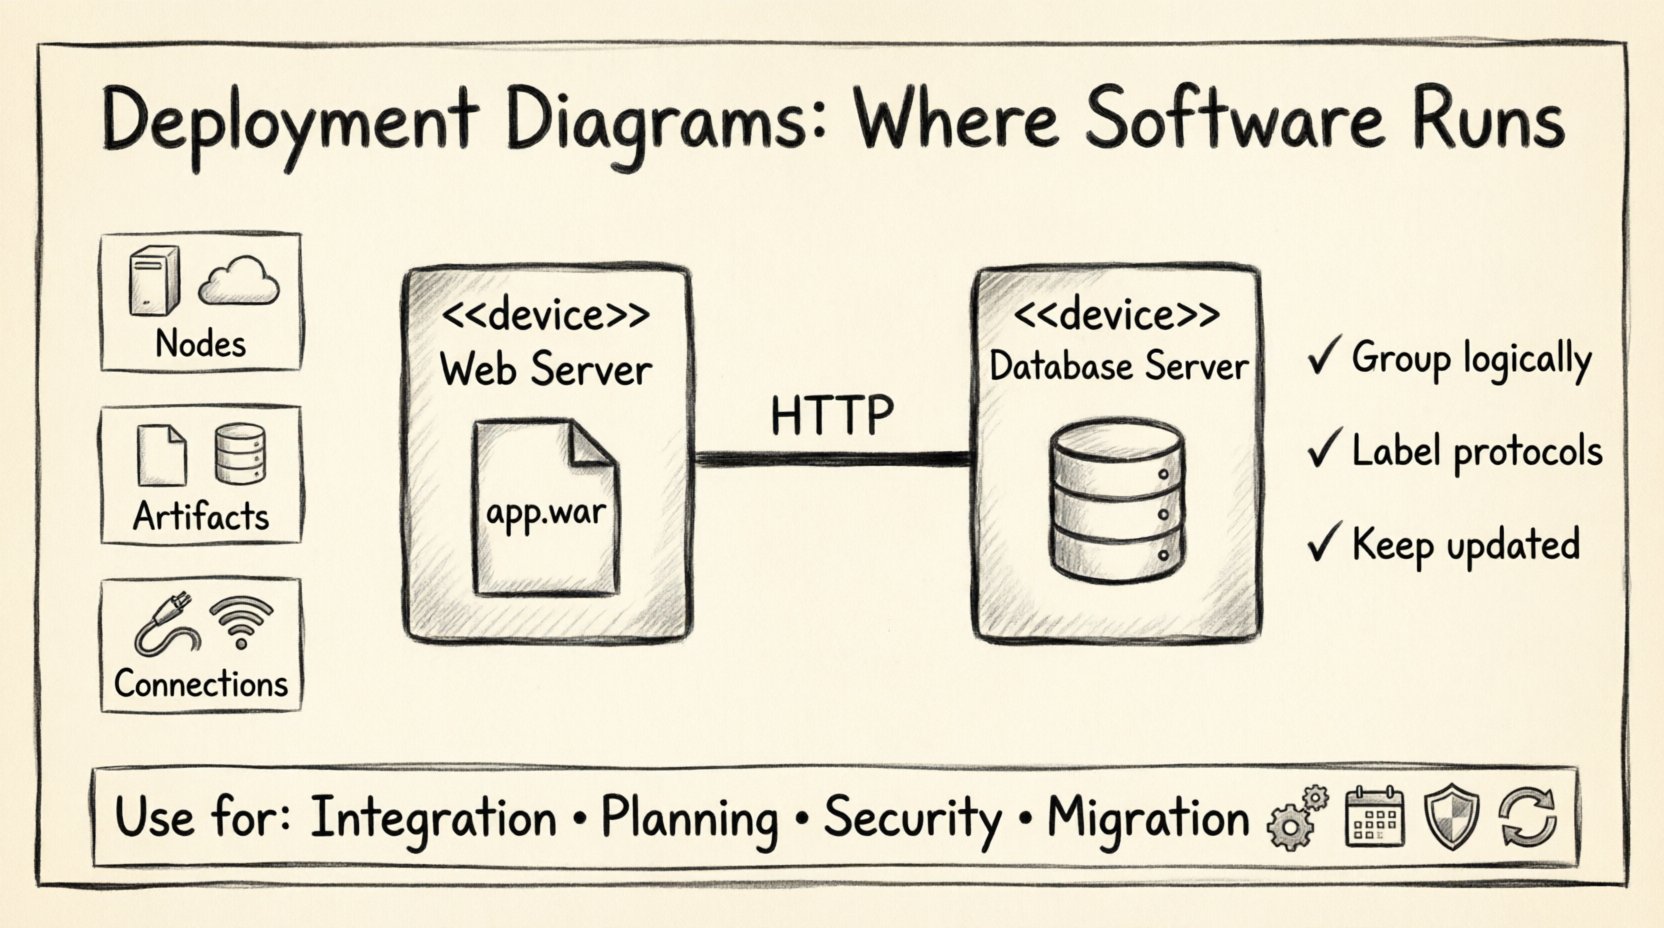
A deployment diagram maps the physical architecture of a system. Unlike structural diagrams that focus on code organization or behavioral diagrams that track flow, deployment diagrams answer the question: where does this software run? They depict the hardware nodes and the software artifacts deployed upon them. This distinction is vital for operations teams, infrastructure engineers, and developers who need to understand the physical topology of the application.
These diagrams serve as a bridge between the logical design of the system and its physical realization. They show the configuration of processing nodes and the artifacts (such as executables, libraries, or databases) placed on those nodes. Furthermore, they illustrate the communication pathways between these nodes, whether through local buses, local area networks, or wide area networks.
🧩 Core Components of the Diagram
To construct a meaningful deployment diagram, one must understand the specific building blocks defined by the UML specification. Each element carries a specific semantic meaning that contributes to the overall clarity of the architecture.
- Nodes: These represent the physical or computational resources where software components are deployed. A node is essentially a physical element that contains processing power and memory.
- Artifacts: These are the software units that are deployed onto the nodes. They can be executables, libraries, data files, or documentation.
- Connections: These represent the communication links between nodes. They define the medium through which data flows, such as TCP/IP, HTTP, or a direct memory bus.
🖥️ Deep Dive into Nodes
Nodes are the foundation of deployment diagrams. They are not merely boxes on a page; they represent actual computational resources. There are generally two types of nodes to consider:
- Device Nodes: These represent physical hardware devices. Examples include servers, workstations, mobile devices, or specialized hardware like routers and firewalls.
- Execution Environment Nodes: These represent a software environment that hosts other artifacts. This could be an operating system instance, a virtual machine, or a container runtime environment.
| Node Type | Represents | Example Use Case |
|---|---|---|
| Device | Physical Hardware | Database Server, Web Browser |
| Execution Environment | Software Runtime | Java Virtual Machine, Linux OS |
| Artifact | Deployable Software Unit | Compiled Class, Executable Binary |
📦 Understanding Artifacts
Artifacts are the tangible units of software. When a developer finishes coding, the result is an artifact ready for deployment. In a deployment diagram, artifacts are often shown as small rectangles with a tab in the top right corner.
- Executable: A binary file that can be run by the operating system.
- Data Store: A repository for persistent information, such as a database or a file system directory.
- Documentation: Manuals, design specs, or API references that are stored on the system.
🔗 Relationships and Dependencies
The power of a deployment diagram lies not just in the static elements, but in the relationships between them. These relationships define how the system behaves at runtime.
- Deployment Association: This shows that an artifact is deployed on a specific node. It indicates a physical or logical placement relationship.
- Communication Association: This connects two nodes to show that they can exchange data. It often includes a stereotype to denote the protocol used, such as HTTP or TCP.
- Dependency: This indicates that one artifact relies on another to function. If the dependent artifact is missing, the system may fail to initialize.
- Realization: This is used when a node realizes the functionality defined by a node type or interface. It implies that the node adheres to a specific standard.
Understanding these relationships helps in identifying bottlenecks. For instance, if multiple artifacts rely on a single node, that node becomes a single point of failure. Architects can use these dependencies to plan for redundancy and load balancing.
🎯 When to Use Deployment Diagrams
While powerful, deployment diagrams are not needed for every project. They are most valuable in specific contexts where infrastructure details matter significantly.
- System Integration: When connecting disparate systems, understanding the physical connection points is essential.
- Capacity Planning: To estimate resource requirements, such as CPU, RAM, and storage, architects need to see what is deployed where.
- Security Auditing: Identifying which nodes handle sensitive data helps in defining security zones and access controls.
- Migration Projects: When moving from on-premise hardware to cloud infrastructure, these diagrams track the transition of artifacts.
- Disaster Recovery: Visualizing the physical layout helps in planning backup strategies for critical nodes.
📐 Best Practices for Clarity
Creating a deployment diagram that is both accurate and readable requires adherence to certain design principles. A cluttered diagram is often worse than no diagram at all.
1. Maintain Abstraction Levels
Do not try to show every single server in a massive enterprise system. Group servers into logical clusters. For example, instead of showing ten individual web servers, show a cluster labeled “Web Tier” connected to a database cluster. This keeps the diagram manageable.
2. Consistent Naming Conventions
Use standard naming for nodes and artifacts. Avoid internal jargon that might confuse external stakeholders. If a node is a database, label it clearly rather than using a cryptic hostname.
3. Group Related Elements
Use compartments or frames to group nodes that belong to the same physical location or security zone. This visual grouping helps the reader understand the topology without reading every connection line.
4. Indicate Communication Protocols
Don’t just draw lines. Label the lines with the protocol being used. A connection labeled “HTTP” implies a different security requirement than one labeled “SSH”. This adds critical context to the architecture.
5. Update Regularly
Infrastructure changes frequently. A deployment diagram that is a year old may be misleading. Treat the diagram as living documentation that evolves with the system.
⚠️ Common Pitfalls to Avoid
Even experienced architects can fall into traps when creating these diagrams. Being aware of common mistakes can save time and prevent miscommunication.
- Over-Detailing: Including too many minor components can obscure the main architecture. Focus on the critical path and high-level infrastructure.
- Ignoring Network Topology: Failing to distinguish between a local network and a wide area network can lead to unrealistic latency assumptions.
- Mixing Logical and Physical: Do not mix logical component diagrams with physical deployment diagrams in the same view. Keep them separate to maintain clarity.
- Static Assumptions: Assuming that the infrastructure is static. Cloud environments are dynamic; the diagram should reflect the intended state, acknowledging that scaling may occur.
- Missing Constraints: Failing to note constraints like security zones or physical location (e.g., “Data must reside in Region A”).
🔗 Integration with Other UML Models
A deployment diagram does not exist in isolation. It works in concert with other UML diagrams to provide a complete picture of the system.
Component Diagrams
While the component diagram shows the logical organization of code, the deployment diagram shows where those components live. You can trace a component from the logical model to the physical artifact in the deployment model.
Sequence Diagrams
Sequence diagrams describe the flow of messages over time. The deployment diagram provides the context for those messages. If a sequence diagram shows a message between two objects, the deployment diagram confirms that those objects are on different nodes that can communicate.
Activity Diagrams
Activity diagrams often show the steps of a process. By mapping these steps to the deployment diagram, you can see which node executes which step. This is useful for identifying which parts of the system are bottlenecks.
🚀 Future Considerations in Architecture
The landscape of software deployment is evolving rapidly. Modern architectures often rely on virtualization and containerization. While the core concepts of deployment diagrams remain valid, the representation must adapt.
- Containerization: Nodes may now represent container orchestration platforms rather than individual machines. Artifacts might be container images rather than executables.
- Serverless Computing: In serverless models, the underlying infrastructure is hidden. Deployment diagrams may need to focus on the service boundaries rather than the specific nodes.
- Microservices: As systems break into smaller services, the number of nodes increases. Aggregation becomes even more critical to keep the diagram readable.
Architects must remain flexible. The goal is not to draw a perfect map of every byte, but to create a clear communication tool that helps the team understand the runtime environment. By focusing on clarity, accuracy, and relevance, deployment diagrams remain an essential tool in the technical documentation arsenal.
✅ Summary Checklist
Before finalizing a deployment diagram, run through this checklist to ensure completeness:
- ☑ Are all nodes clearly labeled?
- ☑ Are all artifacts correctly placed?
- ☑ Are communication protocols specified?
- ☑ Is the abstraction level appropriate for the audience?
- ☑ Are security zones or constraints noted?
- ☑ Is the diagram consistent with the component model?
By following these guidelines, you ensure that the deployment diagram serves its purpose effectively. It becomes a reliable reference for development, operations, and planning, grounding the software in the reality of the infrastructure it will inhabit.

