


In the evolving landscape of project management, the ability to visualize timelines with precision, accuracy, and adaptability has become a critical differentiator. Traditional project scheduling tools—particularly those relying on manual PERT chart construction—remain time-consuming, error-prone, and difficult to scale for complex, multi-phase initiatives such as international conferences, software product launches, or large-scale infrastructure rollouts.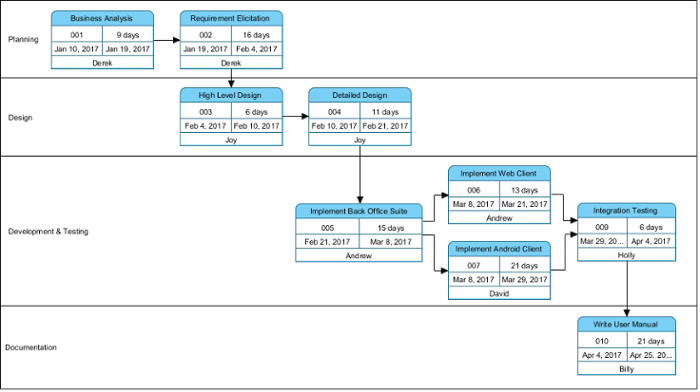

Enter Visual Paradigm’s AI PERT Chart Generator, a cutting-edge solution that leverages generative artificial intelligence to transform natural language project descriptions into professionally structured, editable, and analyzable PERT diagrams in seconds. This tool is not merely a visualization aid; it is a pivotal component of a modern, AI-driven project planning ecosystem that integrates seamlessly with enterprise modeling environments, supports probabilistic scheduling, and automates complex calculations.
Understanding the PERT Framework and Its Evolution
At its core, the Program Evaluation and Review Technique (PERT) is a network-based methodology used to model project timelines by identifying the sequence of tasks, their dependencies, and the duration required to complete each. Unlike simple Gantt charts, PERT charts represent activities as arrows connecting nodes (events) that denote milestones or project phases—enabling the explicit mapping of task precedence and float.
Classical PERT analysis relies on three-point estimation (optimistic, most likely, pessimistic) to calculate expected task durations using the formula:
TE = (O + 4ML + P) / 6
where O = optimistic, ML = most likely, P = pessimistic.
This probabilistic approach accounts for uncertainty in execution, making it ideal for high-stakes or resource-constrained projects. However, the traditional manual construction of PERT charts—requiring forward and backward passes, identification of the critical path, and manual dependency mapping—demands extensive time and deep domain expertise.
Visual Paradigm’s AI PERT Chart Generator addresses these limitations by using advanced natural language processing (NLP) and machine learning models trained on real-world project data to decode project descriptions and generate accurate, standards-compliant PERT diagrams automatically.
How the AI PERT Chart Generator Works: Two Access Points
Visual Paradigm offers flexible access to its AI-powered PERT generation functionality through two primary platforms tailored to different use cases and user needs:
1. Desktop Application (Visual Paradigm Desktop)
For enterprise-level teams requiring full control, deep customization, and integration into existing project repositories, the desktop version provides an immersive, feature-rich environment.
- Access Path: Launch Visual Paradigm Desktop → Navigate to the AI Diagram Generation module.
- Input: Provide a detailed, structured prompt describing the project lifecycle, including phases, tasks, dependencies, durations, and personnel.
- Example Prompt: “Generate a PERT chart for launching a mobile health app with the following sequence: initial market research (2 weeks), UI/UX design (4 weeks), development (12 weeks), QA testing (3 weeks), deployment (1 week), and post-launch support (2 weeks). Include three-point estimates for development and testing, and specify dependencies such as design preceding development and testing following development.”
- Output: The AI parses the prompt and generates a fully structured PERT chart with:
| Feature | Description |
|---|---|
| Swimlanes | Organizes tasks by project phase (e.g., Discovery, Design, Development, Testing, Launch). |
| Event Nodes (Circles/Rectangles) | Represent milestones such as “Market Research Complete” or “App Deployed”. |
| Activity Arrows (AOA) | Indicate the sequence and dependencies between tasks (e.g., “Development must precede Testing”). |
| Task IDs & Assignments | Automatically assigns task IDs (e.g., T101), durations, and personnel (e.g., Alice: Budgeting). |
The generated diagram is not static. It is fully interactive—users can click on any node, modify task durations, adjust precedence relationships, insert lags or leads, or reassign resources without disrupting the underlying structure.
2. Web-Based AI Chatbot (Visual Paradigm Online)
For quick ideation, collaborative brainstorming, or users unfamiliar with formal diagramming tools, the online AI chatbot offers instant, no-install access to PERT generation.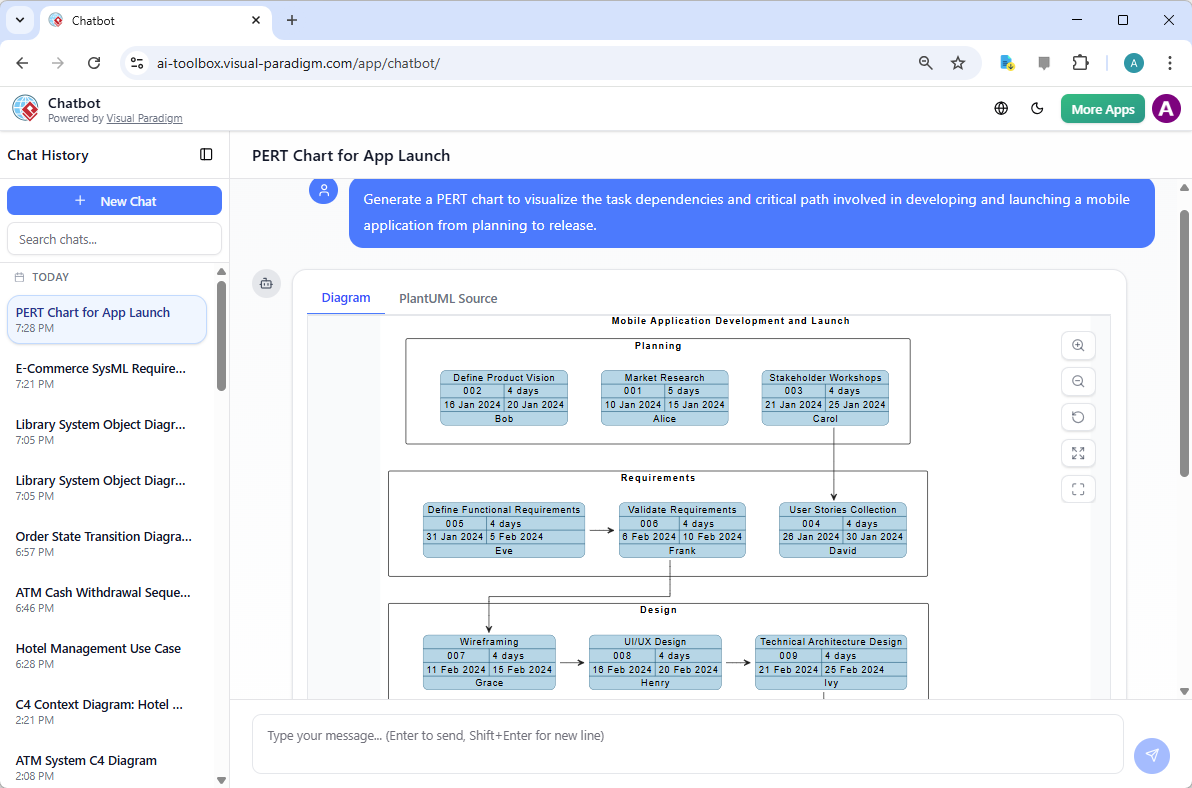
- Access: Visit chat.visual-paradigm.com.
- Interaction: Use conversational prompts such as: “Create a PERT chart for organizing a global summit including venue booking, speaker confirmation, marketing, logistics, and event execution.”
- Output: The chatbot delivers a real-time PERT diagram with optional code exports (e.g., PlantUML or BPMN) for developers or automation workflows.
- Use Cases: Ideal for meetings, sprint planning, stakeholder walkthroughs, or rapid prototyping without requiring prior knowledge of project scheduling principles.
This chat interface also supports side-by-side view of the visual output and its underlying logic, enabling non-technical users to understand how the AI inferred task sequences and dependencies.
Advanced Capabilities Beyond Visualization
Visual Paradigm’s AI PERT tool is more than a diagram generator—it is a dynamic project intelligence engine with built-in analytical features:
1. Critical Path Method (CPM) Automation
Using the AI-generated network, the system automatically computes the critical path—the sequence of activities that determines the minimum project duration. Critical tasks are highlighted in red and marked with zero slack, helping project managers identify bottlenecks and prioritize resource allocation.
2. Probabilistic Scheduling with Three-Point Estimates
The AI supports full PERT logic by enabling three-point estimation per activity. Users can input or adjust optimistic, most likely, and pessimistic values, and the tool calculates the expected duration and standard deviation for each task.
This level of detail enables forecasting of project variance, risk exposure, and contingency planning—particularly valuable in environments with uncertain timelines or external dependencies (e.g., supply chain, regulatory changes).
3. Forward and Backward Pass Calculations
Behind the scenes, the tool performs automated forward and backward passes to compute early start/finish, late start/finish, and float durations for every activity, providing complete visibility into task interdependencies.
4. What-If Scenario Analysis
Change a single parameter—such as increasing the pessimistic estimate for logistics—and instantly regenerate the chart to observe how the project duration shifts. This allows teams to:
- Assess risk exposure in uncertain phases.
- Identify which tasks become critical under stress scenarios.
- Prepare mitigation strategies before execution begins.
5. Seamless Transitions to Other Views
The generated PERT chart can be easily converted into:
- Gantt Charts: For timeline-based scheduling and resource leveling.
- Resource Histograms: To visualize workload distribution across team members.
- Network Views: For deeper analysis of dependencies and critical paths.
These transitions are fully automated, supporting end-to-end project management workflows without the need to manually reconstruct timelines.
6. Standards Compliance and Industry Alignment
All outputs adhere to recognized project management standards, including:
- PERT notation (AOA and AON variants)
- Project Management Institute (PMI) guidelines
- Common practices in PMP and CAPM certification documentation
This makes the generated charts suitable for formal audits, executive presentations, or inclusion in project proposals and compliance reports.
Practical Project Workflows
The AI PERT tool is not a replacement for human judgment—it enhances it by reducing cognitive load and increasing focus on strategic decisions. Below are two widely applicable workflows:
Workflow 1: Rapid Concept-to-Plan Transition
- Open the AI Diagram Generation module in Visual Paradigm Desktop.
- Describe the project in natural language, including key phases, dependencies, and resource needs.
- Generate the PERT chart and review the proposed timeline and critical path.
- Refine estimates, adjust dependencies, or add risk buffers as needed.
- Save the document to a shared repository or collaborate with stakeholders via real-time editing.
Use Case: Planning a software product launch across multiple regions.
Workflow 2: Risk-Based Scenario Modeling
- Build a baseline PERT chart using optimistic or most-likely estimates.
- Create a variant with pessimistic values for high-risk activities (e.g., “Supply chain delays”, “Regulatory approvals”).
- Compare the resulting timelines, critical path changes, and total project duration.
- Identify new risk points and recommend mitigation strategies (e.g., buffer time, contingency teams).
- Share the findings with stakeholders for informed decision-making.
Use Case: Preparing for a global conference where travel, speaker availability, and weather could impact scheduling.
Key Benefits for Modern Project Teams
Adopting the AI PERT Chart Generator delivers significant operational and strategic advantages:
- Speed & Productivity: Up to 80% of structural work is automated, allowing project managers to focus on execution, optimization, and stakeholder communication.
- Accuracy: Eliminates common errors in manual dependency mapping and float calculations.
- Accessibility: The desktop version supports enterprise deployment; the online chatbot enables instant access without installation.
- Collaboration: Real-time editing and version control support team-based planning and review cycles.
- Strategic Insight: Enables teams to move from planning to decision-making by making risks and timelines visible and actionable.
Getting Started: A Step-by-Step Guide
Experience the power of AI-driven PERT scheduling with these simple steps:
- Download Visual Paradigm Desktop: Visit www.visual-paradigm.com/download and download the full desktop edition with AI Diagram Generation.
- Try the Online Chatbot: Visit chat.visual-paradigm.com and test the AI PERT generator with a simple prompt.
- Explore Free Resources: Access templates, tutorials, and best practices on the official site or in the community hub.
- Integrate into Workflows: Begin using the tool during project kickoff or in sprint planning sessions to accelerate timeline construction.
Conclusion: The Future of Intelligent Project Scheduling
Visual Paradigm’s AI PERT Chart Generator represents a paradigm shift in how teams conceptualize, plan, and manage complex projects. By combining the rigor of traditional project management methodologies with the agility and intelligence of generative AI, this tool enables faster, more accurate, and more resilient scheduling decisions.
Whether managing a software launch, a multinational event, or an enterprise transformation initiative, the AI PERT generator provides a clear, actionable view of project timelines—turning abstract dependencies into tangible paths to success. As AI continues to mature in enterprise applications, tools like this will become essential not just for project managers, but for entire product, operations, and strategy teams seeking to reduce risk, cut delivery times, and deliver value with confidence.
Articles and resources related to Visual Paradigm’s AI capabilities and PERT Chart tools for project management:
-
Pert Chart Tool – Visual Paradigm Online: A powerful online tool designed to help project managers visualize task dependencies, estimate timelines, and manage project schedules effectively.
-
Complete PERT Chart Tutorial – Visual Paradigm: A step-by-step tutorial guiding users through creating and using PERT charts in the cloud to plan and manage complex projects efficiently.
-
Pert Chart User Guide – Visual Paradigm: Detailed documentation covering how to create, edit, and utilize PERT charts within the desktop software for robust project management.
-
Free PERT Chart Templates – Visual Paradigm: Access a collection of professionally designed templates to kickstart project planning with minimal setup.
-
Pert Chart Tutorial – Visual Paradigm Knowledge Base: An in-depth resource explaining the purpose, construction, and application of PERT charts in real-world project management scenarios.
-
Enhanced PERT Chart Features – Visual Paradigm: Explore advanced capabilities such as dynamic scheduling, critical path analysis, and seamless integration with project timelines.
-
Project Management Guide – Visual Paradigm User Guide: A comprehensive guide to the platform’s project management suite, including PERT charts, Gantt charts, and resource allocation tools.
-
Pert Chart for Project Management – Cybermedian: This article provides practical insights and real-world online examples for using PERT charts to improve project planning.
-
Integrating PERT Charts with RACI Roles in Task Management: A practical guide on combining PERT charts with RACI roles to enhance timeline accuracy and accountability in management workflows.
-
Visual Paradigm AI Suite: A Comprehensive Guide: This overview details how the platform’s AI Chatbot supports the generation of business diagrams, explicitly including PERT charts, within the modeling environment.