


Customers do not experience your business in the linear fashion you might design it. They navigate a complex landscape of feelings, expectations, and interactions that often remain hidden from internal stakeholders. This invisible experience is where loyalty is built or broken. To understand it, you must make it visible. The customer journey map is the tool that turns abstract data into a tangible narrative. It is not merely a diagram; it is a story told from the perspective of the person on the other side of the screen or the counter.
Creating a clear customer journey map requires discipline, empathy, and a commitment to truth. It demands that you step out of your organizational structure and walk in the shoes of your users. This guide explores the mechanics of mapping, the psychology behind the experience, and the practical steps to visualize the invisible without relying on hype or generic advice.
What is a Customer Journey Map? 🤔
At its core, a customer journey map is a visual representation of every interaction a person has with your brand over time. It captures the full lifecycle, from the first moment of awareness to the final act of advocacy. Unlike a standard process flow, which focuses on internal efficiency, a journey map focuses on the external experience.
Key characteristics include:
- Time-based: It shows progression, not just isolated events.
- User-centric: The protagonist is the customer, not the company.
- Emotional: It tracks feelings, frustration, and satisfaction.
- Channel-specific: It notes where the interaction happens (app, phone, store).
Without this visualization, teams operate in silos. Marketing might optimize for clicks, while support optimizes for resolution time. The journey map bridges these gaps, showing how a marketing promise lands in a support ticket.
Why Visualization Matters for CX 🧠
Human brains are wired for stories. Data points alone often fail to trigger action. When you convert metrics into a visual narrative, you create a shared language across departments. A developer can see why a feature is confusing; a salesperson can understand why a prospect hesitates.
The benefits of this clarity are tangible:
- Alignment: All departments agree on what the customer values.
- Identification of Friction: You can spot where the path becomes difficult.
- Empathy: It forces the team to feel the customer’s frustration.
- Opportunity Discovery: Gaps in the map reveal where you can add value.
When you visualize the journey, you stop guessing about customer needs and start addressing them based on evidence.
Preparation: Before You Draw Anything 📋
Jumping straight into a diagram is a common mistake. A map built on assumptions will crumble when tested against reality. Preparation involves gathering the right intelligence and defining the scope of your work.
1. Define the Scope
A journey map can cover a lifetime relationship or a single transaction. To keep it manageable, focus on a specific scenario. For example, “The Onboarding Experience” or “The Return Process.” Trying to map everything at once leads to clutter and confusion.
2. Gather Qualitative and Quantitative Data
Numbers tell you what is happening; stories tell you why. You need both.
- Quantitative: Analytics, conversion rates, time on page, support ticket volume.
- Qualitative: Interviews, surveys, focus groups, direct feedback.
Combine these sources to paint a complete picture. A high drop-off rate (quantitative) means nothing until you know the user felt confused (qualitative).
3. Build Customer Personas
You cannot map a journey for “everyone.” You must map for specific archetypes. A persona represents a segment of your audience with shared goals and behaviors. Ensure your personas are based on real data, not stereotypes. If you map for a persona that does not exist, the resulting journey will be fiction.
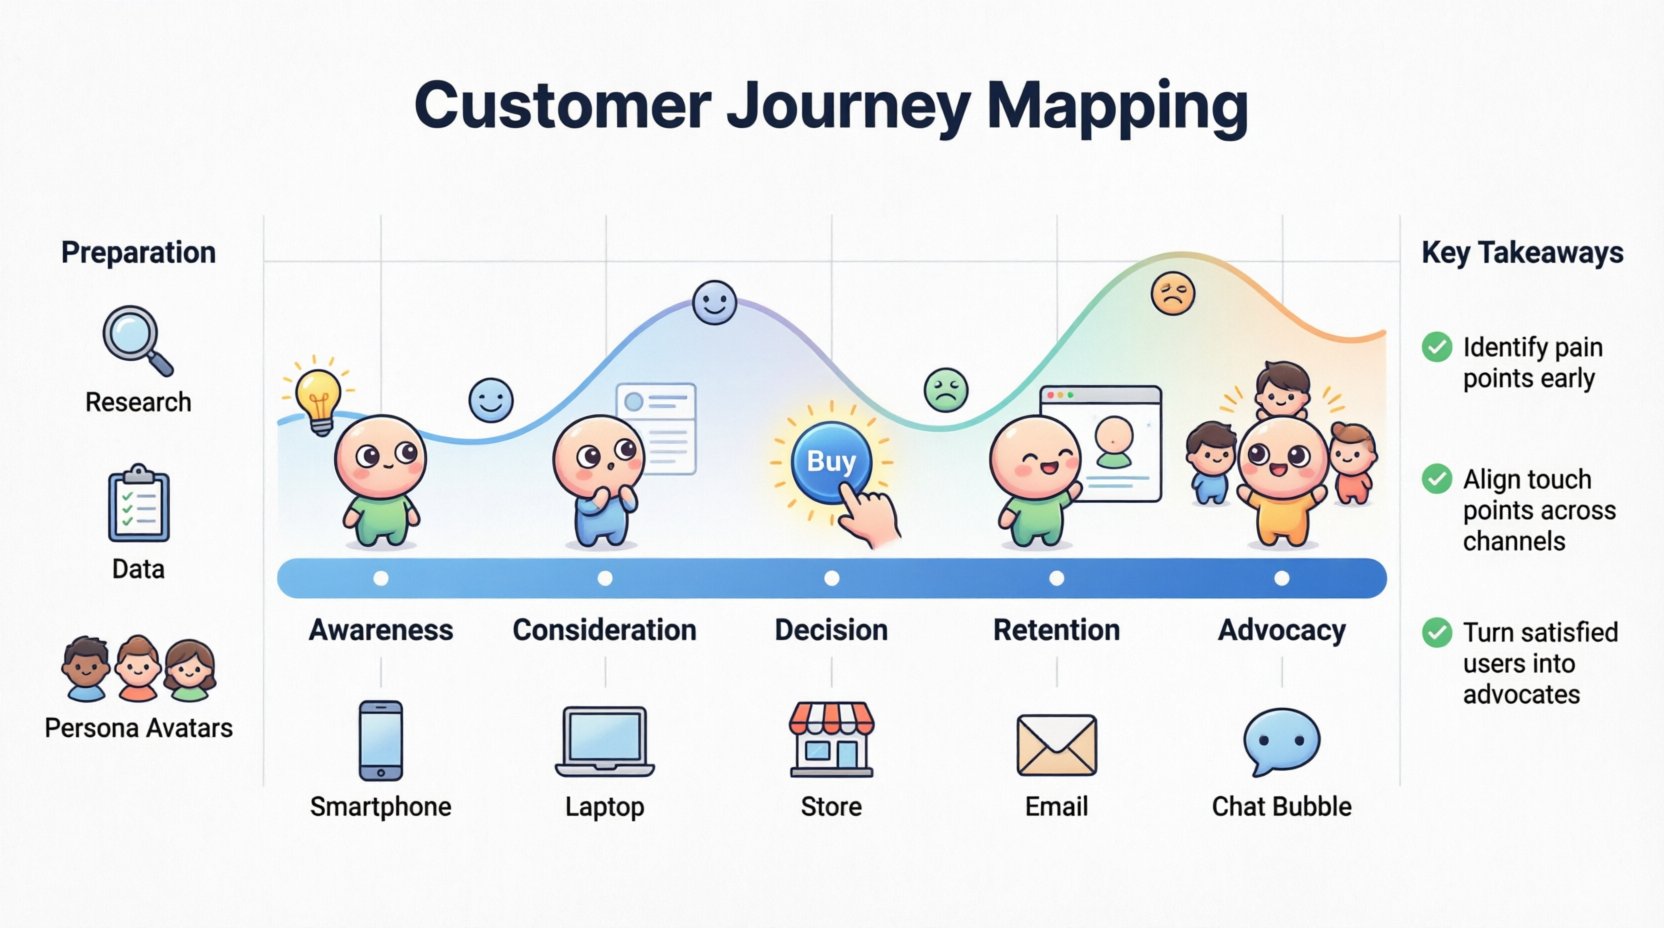
The Step-by-Step Mapping Process 🛠️
Creating the map is a collaborative workshop activity. It should involve cross-functional teams to ensure all touchpoints are represented. Here is the workflow to follow.
Step 1: List the Stages
Break the relationship into logical phases. While every business is different, the general progression usually follows a pattern:
- Awareness: The customer realizes they have a problem.
- Consideration: They look for solutions and evaluate options.
- Decision: They choose a vendor and make a purchase.
- Retention: They use the product or service.
- Advocacy: They recommend the brand to others.
Step 2: Identify Touchpoints
A touchpoint is any moment of interaction. These can be physical or digital. List every channel where the customer might engage with you.
- Website landing pages
- Email newsletters
- Social media ads
- Customer support calls
- Physical packaging
- Mobile app notifications
For each stage, list which touchpoints are relevant. A user in the “Awareness” stage might see an ad, while a user in “Retention” might log into a portal.
Step 3: Map the Actions
What is the customer doing at each touchpoint? Are they reading, clicking, calling, or waiting? Write down the specific actions in chronological order. This creates the backbone of the journey.
Step 4: Capture the Emotions
This is the most critical layer. How does the customer feel at each step? Use an emotional scale to track highs and lows.
- Confused: They do not understand the next step.
- Excited: They see a solution to their problem.
- Frustrated: They hit a roadblock or error message.
- Relieved: The issue is resolved.
Plot these emotions on a curve. The goal is to minimize the dips and maximize the peaks.
Step 5: Highlight Pain Points and Opportunities
Look for the low points on the emotional curve. These are your pain points. Where are customers dropping off? Where are they expressing frustration? Conversely, look for the high points. These are moments of delight. Document what is working well so you can replicate it elsewhere.
Understanding the Emotional Curve 📈
The emotional curve is the heart of the journey map. It transforms a dry list of steps into a human story. A flat line indicates a boring experience; a jagged line indicates inconsistency.
Consider the psychology of the user:
- Early Anxiety: At the start, users are often skeptical. They are evaluating trust.
- Confusion Peaks: During complex processes (like setup or checkout), anxiety often rises.
- Satisfaction: Once the value is delivered, satisfaction should climb.
- Advocacy: Only a positive resolution leads to sharing the experience.
By mapping emotions, you can design interventions. If the curve dips at “Checkout,” you know exactly where to focus your improvement efforts. You might simplify the form, add a progress bar, or offer live chat support.
The Anatomy of a Journey Map Table 📊
To make the data digestible, a tabular structure is often used. This ensures every team member sees the same information clearly.
| Stage | Goal | Touchpoints | User Emotion | Key Metric |
|---|---|---|---|---|
| Awareness | Problem Recognition | Social Ads, Search | Curious / Skeptical | Impressions |
| Consideration | Evaluation | Blog Posts, Reviews | Comparative / Analytical | Time on Page |
| Decision | Purchase | Checkout, Sales Call | Confident / Anxious | Conversion Rate |
| Retention | Usage | Onboarding, Support | Relieved / Satisfied | Churn Rate |
| Advocacy | Referral | Reviews, Social Share | Proud / Enthusiastic | NPS Score |
This table format allows you to scan across a row to see the full context of a specific stage. It highlights where the emotional state aligns with the business goal.
Common Pitfalls to Avoid 🚫
Even with a solid plan, teams often stumble during the execution of journey mapping. Awareness of these traps will help you steer clear of them.
1. The Internal Perspective Trap
It is easy to map how the company thinks it works rather than how the customer actually experiences it. If your map shows a process that is efficient for you but confusing for them, it is the wrong map. Always validate with customer feedback.
2. Relying on a Single Persona
One size does not fit all. A power user may have a completely different journey than a new user. Creating separate maps for different personas ensures you address specific needs without cluttering the main view.
3. Ignoring the “Backstage”
A journey map should not just show the front-facing interactions. It must acknowledge the backend processes that enable them. If a support agent cannot access the right data, the customer will feel the delay. The map should connect the front-end emotion to the back-end reality.
4. Creating it Once and Archiving It
A journey map is a living document. Customer behaviors change, new channels emerge, and products evolve. If you do not update the map regularly, it becomes a historical artifact rather than a strategic tool.
Measuring Success and Iteration 🔄
Once the map is created, the work is not done. You must measure the impact of changes made based on the insights. Use the metrics identified in the map to track progress over time.
- Before vs. After: Compare metrics before implementing changes suggested by the map.
- Customer Feedback: Monitor sentiment scores after touchpoint changes.
- Operational Efficiency: Track if backend improvements reduced resolution times.
Iteration is key. As you fix friction points, the emotional curve will shift upward. This new baseline becomes the starting point for the next cycle of improvement.
Collaboration and Ownership 🤝
A journey map fails if no one takes ownership of the insights. Assign specific actions to specific teams. If the “Decision” stage shows high friction at checkout, the Product team owns that fix. If the “Retention” stage shows confusion, the Training team owns the onboarding content.
Regular review sessions ensure accountability. Bring the map into team meetings. When a new feature is proposed, ask: “Where does this fit on the journey map? Does it improve the emotional curve?”
The Future of Experience Mapping 🚀
The landscape of customer experience is shifting towards hyper-personalization. Maps that were once static documents are becoming dynamic models. While you do not need complex technology to start, the principle remains the same: understand the user, visualize the path, and optimize the experience.
As you move forward, remember that the map is a tool for empathy. It reminds your team that behind every login and every transaction is a human being with hopes, frustrations, and expectations. By visualizing the invisible, you create a business that is not just efficient, but human.
Key Takeaways for Implementation ✅
- Start Small: Map one specific journey before attempting a full lifecycle view.
- Use Real Data: Validate every assumption with interviews and analytics.
- Focus on Emotion: The emotional curve is the most valuable part of the map.
- Keep it Alive: Update the map as your business and customer behaviors change.
- Share Widely: Ensure every department sees the same version of the truth.
The invisible becomes visible when you commit to seeing the customer as they see themselves. This is the foundation of a resilient, customer-centric organization.

