


System architecture is the backbone of any robust software solution. It defines how components interact, how data flows, and how infrastructure supports business logic. Among the various modeling techniques available, the deployment diagram stands out as a critical tool for mapping the physical realization of a system. This guide explores the mechanics, best practices, and strategic application of deployment diagrams without relying on specific vendor tools. 🛠️
Understanding the Deployment Diagram 📐
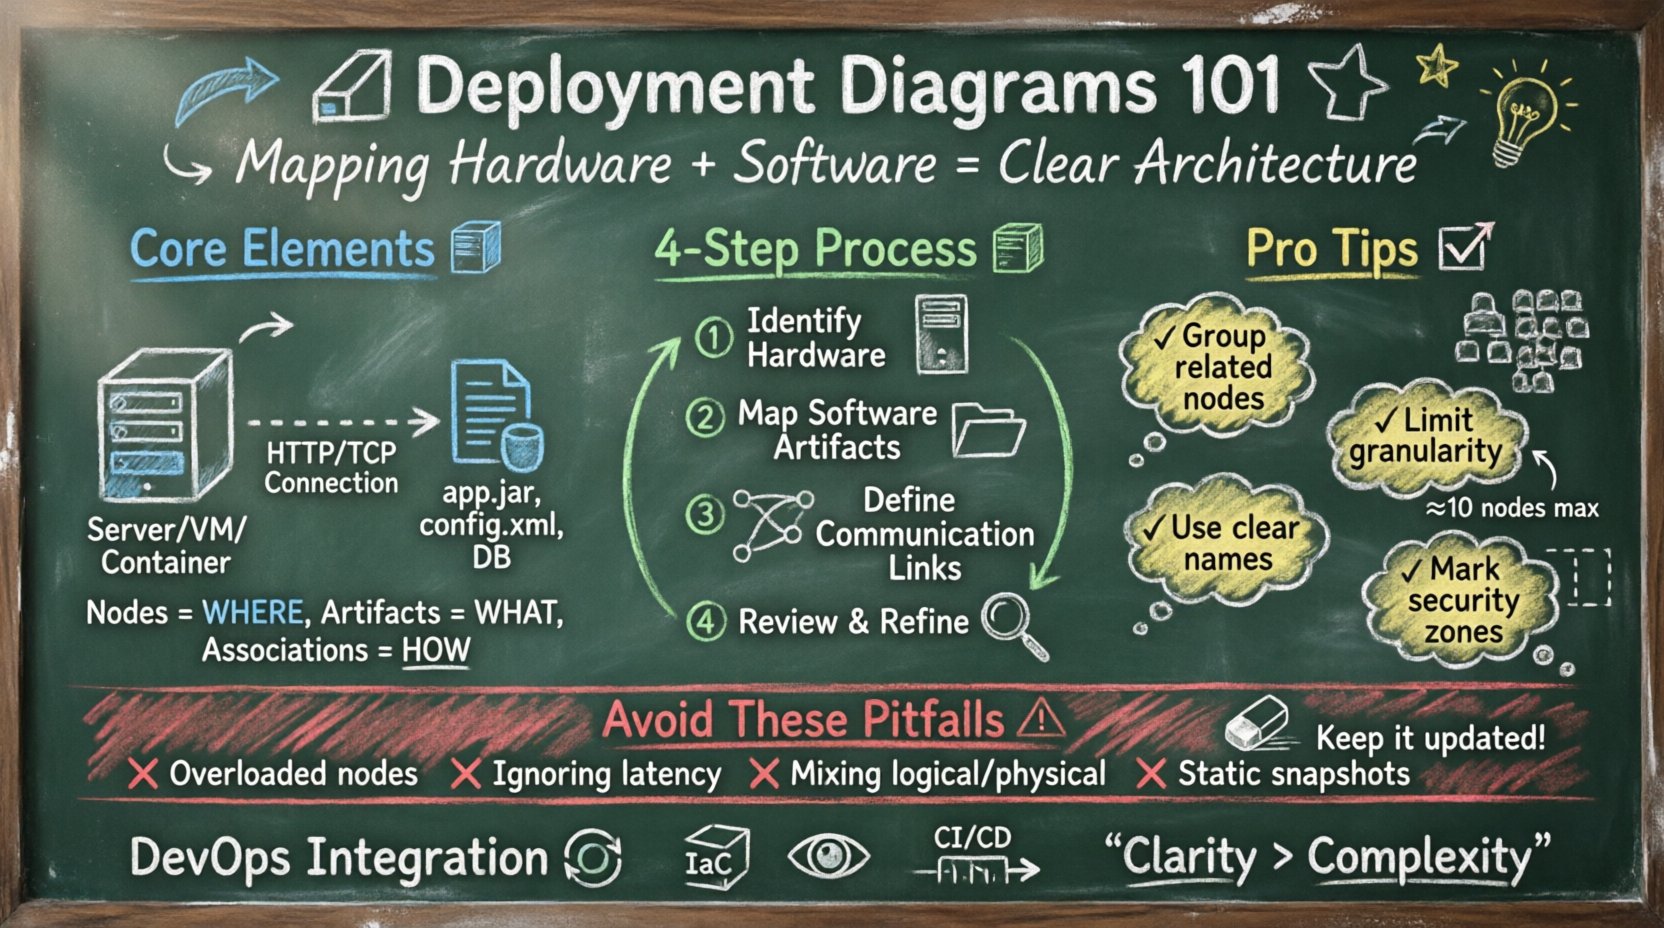
A deployment diagram represents the physical architecture of a system. Unlike component diagrams, which focus on logical relationships, deployment diagrams visualize the hardware topology and the software artifacts running upon it. They answer fundamental questions regarding where processes execute and how nodes communicate.
This visualization serves multiple stakeholders:
- DevOps Engineers: Understand infrastructure requirements for provisioning.
- System Architects: Verify hardware distribution and network boundaries.
- Security Teams: Identify trust zones and data flow paths.
- Project Managers: Visualize the cost and complexity of physical deployment.
By standardizing the representation of nodes and artifacts, teams can reduce ambiguity during the deployment phase. This reduces the risk of configuration errors and ensures that the physical environment matches the design intent. 🔄
Core Elements of a Deployment Diagram 🧱
To construct a meaningful diagram, one must understand the building blocks. These elements interact to create a complete picture of the system’s runtime environment. Every element serves a specific purpose in defining the infrastructure.
1. Nodes (Computational Resources)
Nodes represent physical or virtual hardware devices. They are the execution environments for software artifacts. A node can be a physical server, a virtual machine, a container host, or even an edge device like a router.
- Device Nodes: Represent standard hardware with processing and memory capabilities.
- Execution Environment Nodes: Represent software environments like virtual machines or operating systems.
- Artifact Nodes: Specific instances of hardware used for specialized tasks, such as a database server or a load balancer.
2. Artifacts (Software Units)
Artifacts are the physical representations of software components. They are the files, executables, or libraries that are deployed onto a node. An artifact is not the code itself, but the compiled or packaged version ready for installation.
- Executable Files: Programs that run directly on the operating system.
- Libraries: Shared code dependencies required by the application.
- Configuration Files: Settings that define runtime behavior.
- Databases: Physical data stores residing on specific nodes.
3. Associations (Communication Paths)
Associations depict the communication links between nodes. These lines represent network connections, data streams, or physical cables. They define the trust relationships and data flow constraints between infrastructure components.
- Network Connections: Represented by lines indicating connectivity.
- Interfaces: Define the specific protocols used for communication (e.g., HTTP, TCP/IP).
- Dependencies: Indicate that one node relies on the services of another.
Constructing the Diagram: A Step-by-Step Approach 📝
Creating an accurate deployment diagram requires a systematic approach. It is not merely about drawing boxes and lines; it is about documenting the reality of the system’s physical layout. Follow these logical steps to ensure precision.
Step 1: Identify Hardware Requirements
Begin by listing all necessary hardware resources. Consider processing power, memory capacity, and storage needs. Determine which components require high availability and which can tolerate single points of failure. This step establishes the foundation of the physical model.
- Assess server specifications.
- Identify network devices (switches, routers, firewalls).
- Determine storage infrastructure needs.
Step 2: Map Software Artifacts
Next, identify the software units that need to be deployed. Group related artifacts into logical bundles. Decide which artifacts run on which nodes based on resource requirements and performance needs. This mapping ensures that the software fits the hardware.
- List all executables and libraries.
- Group artifacts by function (e.g., frontend, backend, data).
- Assign artifacts to specific nodes.
Step 3: Define Communication Links
Draw the connections between nodes. Specify the protocols used for data exchange. Ensure that security boundaries are respected in the diagram. If a connection crosses a security zone, label it as such to highlight potential risks.
- Map internal network traffic.
- Map external internet traffic.
- Label protocols and ports.
Step 4: Review and Refine
Finally, validate the diagram against the actual system requirements. Check for missing dependencies or overloaded nodes. Ensure that the diagram is readable and follows standard notation conventions. Consistency is key for long-term maintainability. 🔍
Element Reference Table 📊
The following table summarizes the standard notation and meaning used in deployment diagrams. Using this reference ensures consistency across documentation.
| Element | Notation | Function | Example |
|---|---|---|---|
| Node | 3D Box | Represents hardware or execution environment | Web Server, Database Server |
| Artifact | Document Icon | Represents a software unit or file | app.jar, config.xml, database.db |
| Association | Line with Arrow | Represents communication or dependency | HTTP Connection, File Transfer |
| Interface | Circle or Lollipop | Represents a service point | API Endpoint, Socket Port |
| Dependency | Dashed Line | Indicates a reliance relationship | Service A relies on Service B |
Design Principles for Clarity 🧭
A deployment diagram that is too complex becomes useless. The goal is clarity, not exhaustive detail. Adhering to specific design principles helps maintain the diagram’s utility over time.
1. Maintain Logical Grouping
Group related nodes and artifacts together. Use boundaries or containers to indicate clusters or zones. This helps viewers quickly understand the functional organization of the infrastructure. For instance, group all database nodes within a specific area distinct from application servers.
2. Limit Granularity
Avoid showing every single server if there are hundreds of identical units. Use stereotypes or notes to indicate clusters. For example, represent a load-balanced farm as a single node with a note specifying the count. This prevents visual clutter.
3. Consistent Naming Conventions
Use standardized names for nodes and artifacts. Avoid generic labels like “Server 1” unless it is a temporary placeholder. Use functional names like “Auth-Node-01” or “Payment-Gateway-Node”. This aids in troubleshooting and communication.
4. Indicate Security Zones
Clearly mark boundaries where security policies change. Use dashed lines or shaded areas to denote DMZs, internal networks, or external interfaces. This is critical for security audits and compliance reviews.
Common Pitfalls to Avoid ⚠️
Even experienced practitioners make mistakes when modeling infrastructure. Being aware of common errors helps in creating more reliable diagrams.
- Overloading Nodes: Placing too many artifacts on a single node without considering resource constraints. Always verify CPU and memory capacity.
- Ignoring Latency: Depicting connections without considering network distance. Physical location impacts performance significantly.
- Mixing Logical and Physical: Do not confuse component diagrams with deployment diagrams. Keep logical architecture separate from physical topology.
- Static Snapshots: Failing to update the diagram after changes. Infrastructure evolves rapidly; the diagram must reflect the current state.
- Missing Redundancy: Failing to show backup nodes or failover paths. High availability is a key requirement for modern systems.
Integration with DevOps and CI/CD 🔄
Deployment diagrams are not just static documents; they are living artifacts that integrate with modern development practices. In continuous integration and continuous deployment workflows, the diagram serves as a source of truth for automation scripts.
Infrastructure as Code (IaC):
- Nodes in the diagram can correspond to modules in IaC repositories.
- Artifacts map to container images or binary packages.
- Connections define network policies in the configuration.
Monitoring and Observability:
- Each node should have associated monitoring endpoints.
- Artifacts should have version tags linked to deployment logs.
- Communication paths should be mapped to network flow logs.
This integration ensures that the visual model remains synchronized with the actual running environment. It bridges the gap between design and operations.
Advanced Considerations 🚀
As systems scale, deployment diagrams become more complex. Handling cloud-native architectures and distributed systems requires specific adaptations.
Cloud vs. On-Premise
When modeling cloud environments, treat virtual instances as nodes but acknowledge the underlying provider’s physical infrastructure. Distinguish between managed services and self-managed nodes. This distinction helps in understanding operational responsibilities.
Containerization
In containerized environments, the “Node” might be a Kubernetes node or a Docker host. Artifacts become container images. Deployments are defined by orchestrators rather than direct file transfers. The diagram should reflect the orchestration layer.
Microservices
For microservices, a single artifact might represent a small service. The diagram can become dense quickly. Focus on the topological relationships rather than individual service instances. Group services by domain or business capability.
Maintaining the Diagram Over Time 🛡️
A deployment diagram is only valuable if it is accurate. Regular maintenance is essential to preserve its utility.
- Version Control: Store diagrams in a version control system alongside code.
- Change Management: Update the diagram whenever infrastructure changes occur.
- Review Cycles: Include diagram reviews in architectural decision records.
- Automation: Where possible, generate diagrams from infrastructure state files to reduce manual effort.
By treating the diagram as code, teams ensure that it remains a reliable reference point throughout the system lifecycle. This discipline prevents technical debt from accumulating in the documentation layer.
Conclusion on Architecture Visualization ✅
Visualizing system architecture through deployment diagrams is a fundamental skill for technical teams. It translates abstract requirements into concrete infrastructure plans. By understanding nodes, artifacts, and their relationships, teams can design resilient systems that meet performance and security goals.
The process requires attention to detail and a commitment to accuracy. It is not about creating pretty pictures; it is about communicating complex physical realities clearly. When done correctly, these diagrams become invaluable assets for deployment, troubleshooting, and scaling. 🎯
Remember to focus on clarity, consistency, and relevance. Avoid clutter and stick to the essential elements that impact the system’s operation. With practice, creating effective deployment diagrams becomes a natural part of the architectural workflow. This approach ensures that the infrastructure supports the software, and the software supports the business. 🌐

