


1. Introduction
A UML Deployment Diagram is a structural diagram in the Unified Modeling Language (UML 2.5) that models the physical deployment of software artifacts onto hardware nodes—such as devices, servers, containers, or cloud instances.
It answers a critical real-world question:
“Where does the software actually run, and how do its components communicate in the physical environment?”
While class diagrams focus on logical relationships and component diagrams show modular software structure, deployment diagrams zoom out to reveal the runtime topology—the actual infrastructure where the system executes.
✅ Why Use Deployment Diagrams?
Deployment diagrams are essential for:
-
System architects and DevOps engineers
-
Infrastructure planning and capacity estimation
-
Deciding between cloud vs. on-premise hosting
-
Designing secure, scalable, and performant systems
-
Facilitating cross-team alignment (development, operations, security)
They serve as a common language between technical teams and stakeholders, reducing ambiguity during deployment, scaling, and troubleshooting.
2. Key Concepts & Elements
Below is a comprehensive overview of the core elements used in UML Deployment Diagrams, including their notation, purpose, and common stereotypes.
| Element | UML Notation | Purpose | Common Stereotypes |
|---|---|---|---|
| Node | 3D cube or rectangle with <<device>> or <<execution environment>> |
Represents physical or virtual hardware: server, VM, container, mobile device, cloud instance | <<device>>, <<executionEnvironment>>, <<cloud>>, <<region>> |
| Artifact | Rectangle with folded corner | A deployable unit of software: .war, .jar, .exe, Docker image, SQL script, config file |
<<artifact>>, <<file>>, <<script>>, <<database>> |
| Deployment | Dashed arrow with <<deploy>> |
Shows that an artifact is deployed to a node | <<deploy>> |
| Communication Path | Solid line (association) | Physical or logical connection between nodes (network, protocol, bus) | <<TCP/IP>>, <<HTTPS>>, <<MQTT>> |
| Manifestation | Dashed arrow with <<manifest>> |
Indicates that an artifact implements or manifests a component | <<manifest>> |
| Node Nesting | Node inside another node | Hierarchical structure: e.g., container inside VM, VM inside data center | — |
🔍 Important Notes:
-
Nodes can contain other nodes (e.g., a VM inside a server) or artifacts.
-
Use multiplicity notation like
[2]or{2}to indicate multiple instances. -
Execution environments (e.g., Tomcat, Node.js, Kubernetes Pod, Docker) are often modeled as nested nodes.
-
Always include protocols and ports on communication paths—this is vital for ops teams.
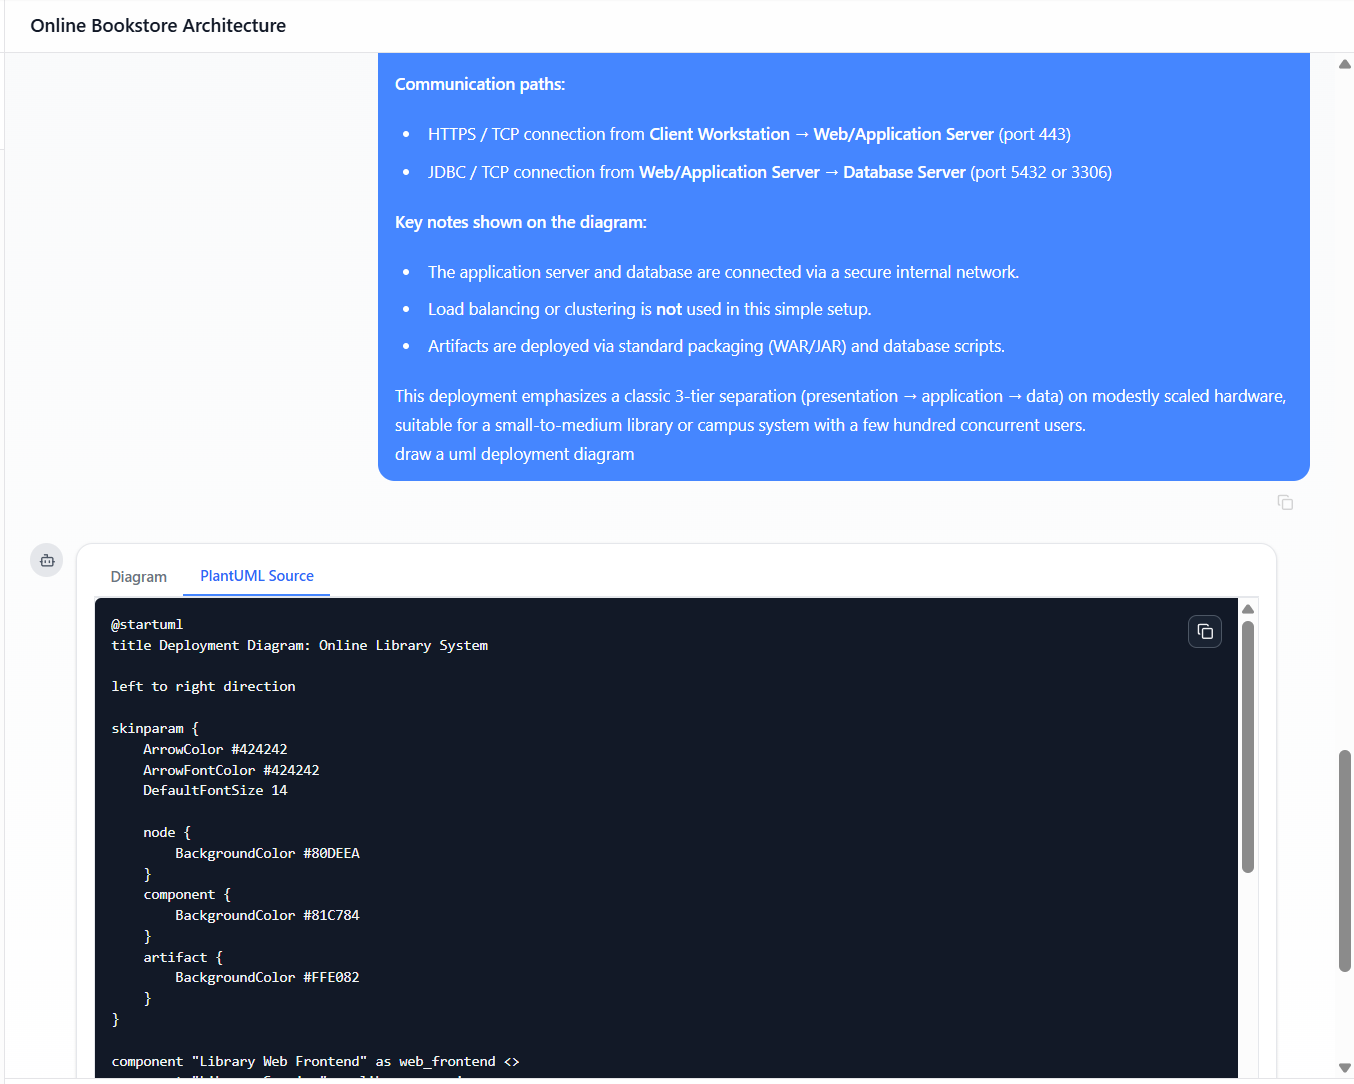
3. Case Study: Simple Online Library System
📌 Short Description
This deployment diagram illustrates the physical architecture of a small, web-based Online Library System. The system follows a classic 3-tier architecture with minimal redundancy.
🖥️ System Components & Deployment
The system runs across three primary nodes:
| Node | Description |
|---|---|
| Client Workstation | User’s PC or mobile device with a standard web browser (no custom software). |
| Web/Application Server | A single Linux server (Ubuntu) running Tomcat or Node.js to host the frontend and business logic. |
| Database Server | A dedicated server running PostgreSQL or MySQL for persistent data storage. |
🔗 Communication Flow
-
Client → App Server: HTTPS over port 443 (secure web traffic)
-
App Server → DB Server: JDBC over port 5432 (PostgreSQL default)
⚠️ Note: This is a simple, non-clustered setup with no load balancing, caching, or high availability—ideal for prototyping or small-scale deployments.
🖼️ The Actual Deployment Diagram (Generated by Visual Paradigm AI Chatbot)

Here is the ready-to-use PlantUML code that exactly matches the described architecture. Paste it into any PlantUML renderer to generate a professional diagram instantly.
-
Generated by Visual paradigm AI Chatbot (PlantUML Deployment Diagram code)
@startuml
title Deployment Diagram: Online Library System
left to right direction

skinparam {
    ArrowColor #424242
    ArrowFontColor #424242
    DefaultFontSize 14
    node {
        BackgroundColor #80DEEA
    }
    component {
        BackgroundColor #81C784
    }
    artifact {
        BackgroundColor #FFE082
    }
}

component "Library Web Frontend" as web_frontend <<web application>>
component "Library Service" as library_service <<business logic>>

node "Client Workstation" <<device>> as client_workstation {
    artifact "Library Web App (Browser)" as browser_app
}

node "Web/Application Server" <<device>> as app_server {
    artifact "library-web.war" as web_war
    artifact "library-service.jar" as service_jar
}

node "Database Server" <<device>> as db_server {
    artifact "library-db" as db_schema
}

client_workstation --> app_server : HTTPS (port 443)
app_server --> db_server : JDBC (port 5432)

web_war ..> web_frontend : <<deploy>>
service_jar ..> library_service : <<deploy>>
db_schema ..> library_service : <<accesses>>

note right of db_server
  PostgreSQL / MySQL instance
  Dedicated database server
end note

note left of app_server
  Ubuntu + Tomcat or Node.js
  Hosts web and business logic
end note

note right of client_workstation
  User device: PC, tablet, or mobile
  Only requires a web browser
end note

@enduml
🛠️ How to Render It Instantly
-
Paste the entire code block above
-
Click “Generate” → instantly see a clean, professional diagram
💡 Pro Tip: Use VS Code + PlantUML extension, IntelliJ IDEA, or GitHub Actions to integrate diagrams into your CI/CD pipeline—perfect for version-controlled documentation.
4. Best Practices: Guidelines for Creating Effective Deployment Diagrams
Follow these principles to ensure your deployment diagrams are clear, actionable, and maintainable.
✅ 1. Choose the Right Level of Abstraction
-
High-level: Show only 3–5 key nodes (e.g., Client – App – DB)
-
Detailed: Add firewalls, load balancers, message queues, CDN, Kubernetes pods, etc.
🔎 Start simple, then expand as needed.
✅ 2. Follow the 3-Tier Architecture Rule of Thumb
Most systems naturally fit into:
-
Presentation Tier → Client devices
-
Application Tier → Web/app servers
-
Data Tier → Database servers
This pattern improves clarity and scalability planning.
✅ 3. Always Include These Elements
-
✅ Physical or virtual nodes (with
<<device>>or<<executionEnvironment>>) -
✅ Artifacts with real file names (e.g.,
app.jar,schema.sql) -
✅ Communication paths with protocols and ports (e.g.,
HTTPS (443)) -
✅ Deployment relationships using
<<deploy>> -
✅ Stereotypes to self-document roles (e.g.,
<<cloud>>,<<database>>)
✅ 4. Use Stereotypes Liberally
Stereotypes make diagrams self-explanatory without needing a legend:
node "AWS EC2 Instance" <<server>> as ec2
node "Redis Cache" <<cache>> as redis
node "Kubernetes Pod" <<container>> as pod
✅ 5. Keep Diagrams Readable & Scalable
-
Limit to 5–7 nodes per diagram
-
Use consistent color schemes:
-
Blue: Devices, servers
-
Green: Components, services
-
Yellow: Artifacts, files
-
-
Group related nodes using packages or frames
package "Production Environment" {
    node "App Server 1"
    node "App Server 2"
}
✅ 6. Version and Document Your Diagrams
Add a version note to avoid confusion:
note bottom of app_server
  Production Deployment – v1.2 – March 2026
  Last updated: 2025-04-05
end note
5. Pro Tips & Advanced Techniques
🎯 Tip 1: Use PlantUML for Version Control & Automation
-
Write diagrams as text files in
.pumlformat -
Store in Git alongside code
-
Auto-generate diagrams during builds (via CI/CD)
-
Enables traceability, collaboration, and reproducibility
🎯 Tip 2: Model Redundancy & Scalability
Show horizontal scaling with multiple instances:
node "Load Balancer" as lb
node "App Server 1" <<device>> as app1
node "App Server 2" <<device>> as app2
lb --> app1
lb --> app2
🎯 Tip 3: Cloud-Specific Patterns
Use domain-specific stereotypes for cloud architectures:
node "us-east-1" <<AWS Region>> as region
node "AWS Lambda" <<function>> as lambda
node "S3 Bucket" <<storage>> as s3
node "Elastic Kubernetes Service (EKS)" <<cluster>> as eks
🎯 Tip 4: Visualize Security & Networking
Add firewalls, DMZs, or network zones:
node "Firewall" <<security>> as firewall
client_workstation --> firewall : HTTPS (443)
firewall --> app_server : Allowed (port 443)
Or use notes to document policies:
note right of app_server
  Internal network only
  No direct access from public internet
  Firewall rules applied
end note
🎯 Tip 5: Integrate with Other UML Diagrams
-
Link to Component Diagrams (logical vs. physical)
-
Reference Network Topology Diagrams (cabling, switches)
-
Use in CI/CD pipelines to verify artifact deployment paths
🎯 Tip 6: Avoid Common Pitfalls
| ❌ Mistake | ✅ Fix |
|---|---|
| Mixing logical components with physical nodes | Keep component and deployment diagrams separate |
| Omitting ports and protocols | Always label communication paths: HTTPS (443), JDBC (5432) |
| Creating one massive diagram for microservices | Break into modular diagrams (e.g., one per service cluster) |
🎯 Tip 7: Advanced PlantUML Customization
Fine-tune appearance for publication or presentations:
skinparam node {
    shadowing false
    borderColor #263238
    BackgroundColor #E0F7FA
}
skinparam artifact {
    BackgroundColor #FFF8E1
}
hide stereotype
📌 Pro Insight: Use
hide stereotypewhen you want a clean, minimalist look—ideal for slides or documentation.
✅ Final Recommendation
“Start every new system—or major refactor—with a 3-tier deployment diagram.”
It takes just 10 minutes to create a diagram like the one above, but it can save hours of miscommunication, deployment errors, and rework.
✅ Your Action Plan:
-
Copy the PlantUML code from the Online Library System example
-
Render it using PlantUML Live
-
Use it as a foundation for your architecture documentation
-
Extend it as your system evolves:
-
Add Redis cache
-
Introduce message queues (RabbitMQ/Kafka)
-
Deploy on Kubernetes clusters
-
Enable multi-region deployment (e.g.,
us-east-1,eu-west-1) -
Add CDN, WAF, or serverless functions
-
📌 Want More?
Let me know if you’d like:
-
A microservices + Kubernetes + multi-region deployment diagram
-
A Draw.io (diagrams.net) version of this diagram
-
A Lucidchart or Visio template
-
A CI/CD pipeline integration guide for PlantUML
-
A template library for common architectures (e.g., serverless, edge computing, IoT)
🎉 Happy Diagramming!
“A picture is worth a thousand words”—but a well-crafted UML deployment diagram is worth a thousand deployments.”
Start building your architecture with clarity.
Use PlantUML. Version your diagrams. Share them. Scale confidently.
💬 Got a system to diagram? Drop a description below—I’ll generate the PlantUML code for you.
UML State Diagram Tooling with Visual Paradigm and AI
Core Features of Visual Paradigm for UML State Diagrams
✅ 1. AI-Powered Generation & Refinement
Visual Paradigm leverages artificial intelligence to eliminate the friction of manual diagramming, making it accessible even to non-experts.
🔹 Text-to-Diagram Generation (AI Diagram Generator)
-
How it works: Describe a system’s behavior in plain English, and the AI instantly generates a structured UML state diagram.
-
Example Prompt:
“Create a state diagram for an online order: starts as ‘Created’, transitions to ‘Paid’ upon payment, then to ‘Shipped’ when dispatched. Add a ‘Cancelled’ state that can be triggered at any time before shipment.”
-
Output: A fully formed state machine with:
-
Correctly named states (
Created,Paid,Shipped,Cancelled) -
Valid transitions with labeled triggers (e.g., “Payment Received”, “Cancel Order”)
-
Guard conditions where applicable
-
Proper UML syntax and layout
-
📌 Benefit: Reduces design time from hours to seconds.
🔹 Conversational AI Assistant
-
Interact with an AI chatbot directly inside the editor.
-
Use natural language to edit the diagram iteratively:
-
“Add a transition from ‘Pending’ to ‘Error’ when payment fails.”
-
“Make ‘Shipped’ a composite state with substates: ‘In Transit’ and ‘Delivered’.”
-
“Rename ‘Created’ to ‘Pending Confirmation’.”
-
-
The AI interprets the request, updates the diagram, and maintains UML consistency.
🔹 Automated Best Practices Enforcement
-
The AI ensures generated diagrams follow UML standards and best practices:
-
No unreachable states
-
No orphaned transitions
-
Proper use of initial/final states
-
Correct nesting in composite states
-
-
Prevents common modeling errors that lead to confusion or incorrect implementation.
✅ Ideal for teams with mixed experience levels—junior developers can create professional diagrams with minimal training.
Intelligent Editing & Modeling Features
Visual Paradigm doesn’t just generate diagrams—it empowers users to build, refine, and manage complex state machines with precision.
🔹 Real-Time Validation
-
As you edit, the AI continuously analyzes the diagram for logical flaws:
-
Unreachable states (e.g., a state with no incoming transitions)
-
Deadlocks (no exit path from a state)
-
Missing initial/final states
-
Invalid transitions (e.g., looping without proper guard conditions)
-
-
Visual alerts and inline suggestions help resolve issues instantly.
🔹 Smart Manipulators & Resource Catalog
-
Drag-and-drop tools that intelligently suggest valid connections:
-
When placing a new state, the tool suggests logical transitions.
-
When adding a transition, it auto-suggests event names and guard conditions.
-
-
Access a Resource Catalog with pre-defined templates for common patterns:
-
Login sessions
-
Order processing
-
Device power states
-
Workflow approvals
-
🔹 Handling Complex State Machines
Supports advanced UML constructs essential for real-world systems:
-
Composite States: Nested substates (e.g.,
Shipped→In Transit→Delivered) -
Orthogonal Regions: Parallel state machines (e.g., a device has both “Power On” and “Connected to Network” states simultaneously)
-
Guard Conditions: Express logic like
if (paymentMethod == "CreditCard") -
Entry/Exit Actions: Define actions executed when entering or exiting a state
-
Internal Transitions: Events that trigger actions without changing state
🎯 Use Case: Modeling a smart thermostat with multiple parallel behaviors (temperature control, Wi-Fi status, user interface state).
Integrated Workflow & Automation
Visual Paradigm turns state diagrams from static documentation into living, executable artifacts in the development lifecycle.
🔹 Design-to-Code Generation
-
Generate skeleton code in popular languages directly from the finalized diagram:
-
Java
-
C#
-
Python
-
-
The generated code includes:
-
State classes and transition logic
-
Event handlers
-
Guard condition checks
-
Entry/exit actions
-
-
Accelerates implementation and ensures model-to-code consistency.
📌 Example: A state diagram for a payment gateway can generate a
PaymentStateMachine.javafile withonPaymentReceived(),onTimeout(), andonCancel()methods.
🔹 Documentation Integration with OpenDocs
-
Embed diagrams directly into technical documentation using OpenDocs.
-
Automatically syncs updates—when the diagram changes, the documentation reflects it in real time.
-
Supports export to PDF, HTML, Markdown, and integration with Confluence, Notion, and GitBook.
🔹 Change Comparison Tool
-
Use the “Compare with Previous” feature to track AI-driven or manual changes:
-
Visual diff highlighting added/removed states, transitions, or guards
-
View version history and revert if needed
-
-
Critical for audit trails, team collaboration, and compliance.
💡 Ideal for: Agile teams iterating on state logic, or regulatory environments requiring traceability.
Availability & Accessibility
Visual Paradigm offers both desktop and cloud (online) versions, ensuring flexibility across teams and workflows:
| Platform | Features |
|---|---|
| Desktop (Windows/macOS) | Full-featured IDE, offline use, high performance |
| Online (Web-based) | Cloud collaboration, real-time sharing, accessible from any device |
✅ Both versions include the AI Diagram Generator, AI Chatbot, real-time validation, and code generation.
Best Practices & Recommendations
| Best Practice | Why It Matters |
|---|---|
| Start with natural language | Speeds up initial design and encourages stakeholder input |
| Use AI to prototype, then refine manually | Balances speed with precision |
| Validate the diagram before code generation | Prevents runtime bugs from flawed logic |
| Use OpenDocs for documentation | Ensures diagrams stay up-to-date with the system |
| Leverage the comparison tool | Track changes during iterative design |
⚠️ Caution: While AI is powerful, it may occasionally generate incorrect or suboptimal logic. Always review outputs for correctness, especially in safety-critical or financial systems.
Conclusion
Visual Paradigm has redefined the way teams create and manage UML State Diagrams. By combining natural language input, AI-driven generation, real-time validation, and end-to-end automation, it transforms state modeling from a time-consuming task into an intuitive, collaborative, and productive process.
Whether you’re designing a simple user login flow or a complex industrial control system, Visual Paradigm empowers you to:
-
Design faster
-
Model smarter
-
Validate earlier
-
Code automatically
✅ Final Tip: Start every new system with a state diagram—even if just to clarify behavior. Use Visual Paradigm’s AI to generate it in seconds. Then refine it with your team. The result? A shared, executable understanding of your system’s behavior.
Reference List
- AI Diagram Generator – Visual Paradigm: Official release notes detailing the launch and capabilities of Visual Paradigm’s AI Diagram Generator, including text-to-UML features for state diagrams.
- Create UML State Diagrams in Seconds with AI – Visual Paradigm: A step-by-step guide demonstrating how to generate UML state diagrams from plain text using AI, with real-world examples and use cases.
- What is a State Machine Diagram? – Visual Paradigm: A foundational article explaining the purpose, structure, and best practices for UML state machine diagrams.
- Mastering State Diagrams with Visual Paradigm AI – Cybermedian: A practical guide showcasing how AI-enhanced state diagrams are used in real-world systems like automated toll collection.
- Visual Paradigm on X (Twitter): Official social media channel for Visual Paradigm, featuring product updates, tips, and user-generated examples of AI-powered modeling.
- Comprehensive Review: Visual Paradigm’s AI Diagram Generation: A detailed evaluation of the AI Diagram Generator’s accuracy, usability, and integration with development workflows.
- AI Chatbot – Visual Paradigm: Overview of the AI assistant that enables conversational editing of UML diagrams, including state diagrams.
- OpenDocs Update: AI State Diagram Generator – Visual Paradigm: Announcement of enhanced documentation integration, allowing state diagrams to be embedded and synchronized in technical documentation.
- Visual Paradigm AI State Diagram Tutorial – YouTube: A video tutorial demonstrating how to use the AI Diagram Generator to create a state diagram for an e-commerce order process.
- About State Diagrams – Visual Paradigm: A comprehensive overview of UML state diagrams, including their components, syntax, and real-world applications.
- Creating State Diagrams – Visual Paradigm User Guide: Detailed step-by-step instructions for building state diagrams, including composite states and guard conditions.
- Advanced State Machine Features – Visual Paradigm: A deep dive into advanced modeling techniques using Visual Paradigm, including nested states, orthogonal regions, and event handling.
- Compare with Previous – Visual Paradigm User Guide: Documentation on the change comparison feature, enabling teams to track and manage revisions in state diagrams over time.