


In the modern retail landscape, acquiring a new customer is often more expensive than retaining an existing one. Despite heavy marketing spend, many businesses struggle with high churn rates. A leading mid-sized apparel retailer faced this exact challenge. They had strong initial sales but saw a significant drop-off after the first purchase. To address this, the leadership team turned to a strategic approach known as customer journey mapping. This case study details how they analyzed touchpoints, identified friction, and implemented changes that resulted in measurable retention growth without relying on specific software tools.
The Challenge: High Acquisition, Low Loyalty 📉
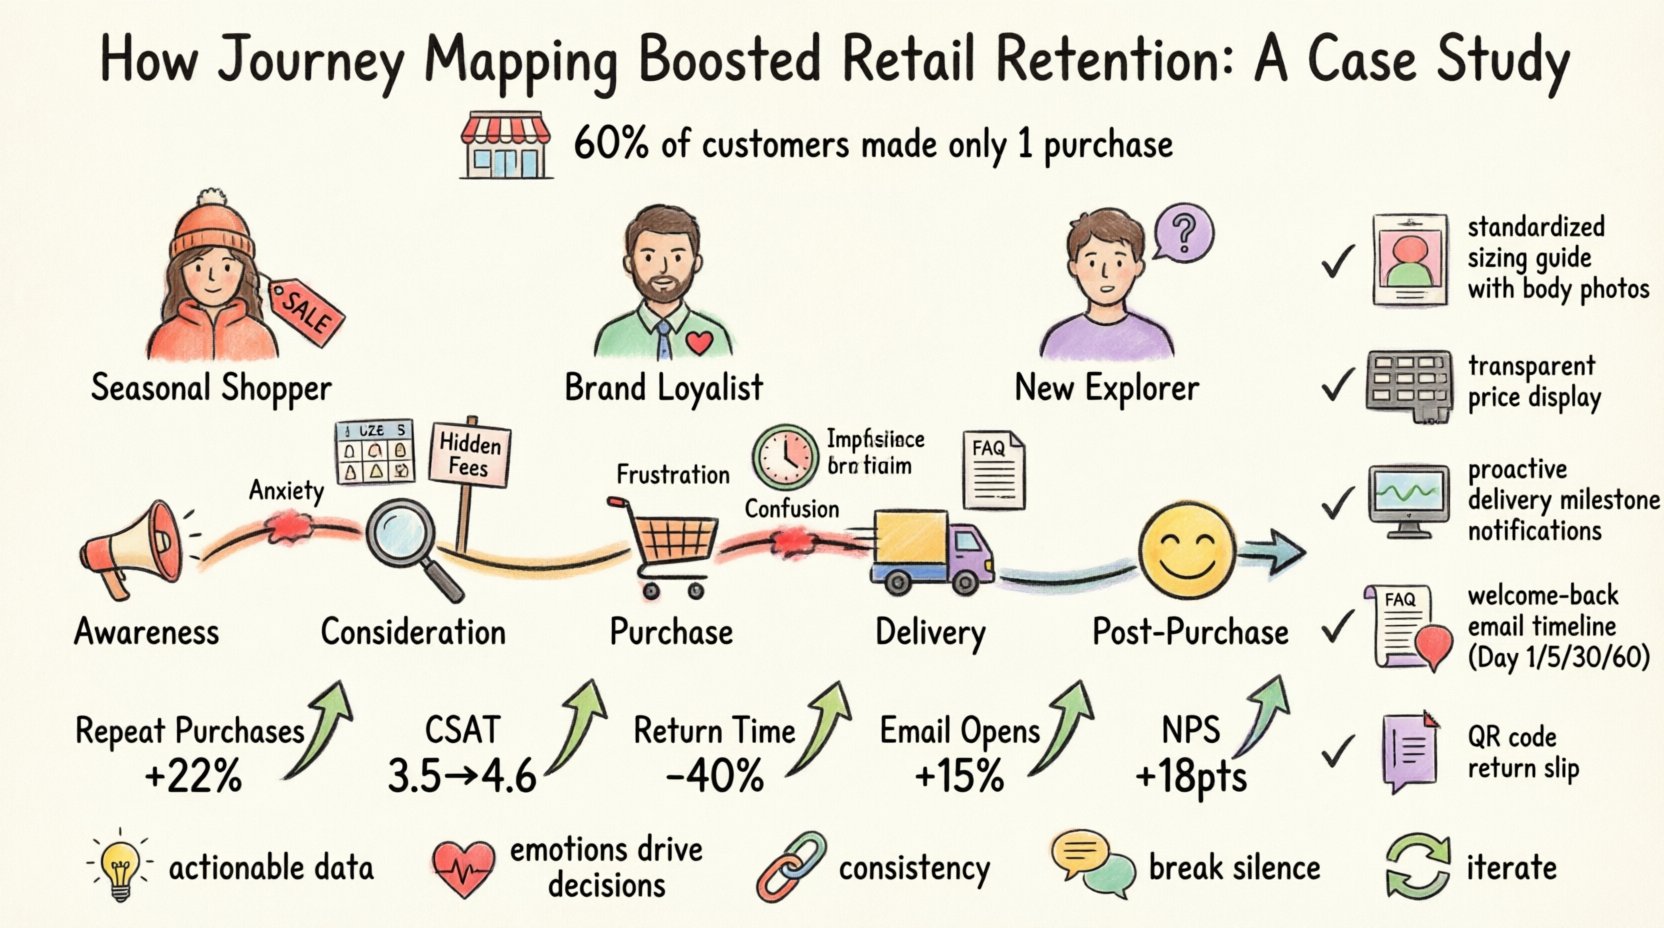
The retailer, operating primarily online with a physical presence in select cities, noticed a discrepancy in their data. While customer acquisition costs were stable, the lifetime value (LTV) was stagnating. Approximately 60% of customers made only a single purchase before disappearing from the database. The marketing team attributed this to seasonal trends, but deeper analysis suggested a broader experience issue.
The primary issues identified were:
- Fragmented Communication: Post-purchase emails were generic and did not align with the delivery timeline.
- Confusing Return Process: Customers found the instructions for returns difficult to locate and understand.
- Lack of Personalization: Recommendations were based on broad categories rather than individual preferences.
- Disconnected Channels: In-store experiences did not reflect online browsing history.
Without a clear view of the customer’s path from awareness to advocacy, the company could not effectively address these pain points. They needed to see the journey through the eyes of the buyer.
Phase 1: Defining the Scope and Personas 👥
The first step in the journey mapping initiative was to establish who the customer actually was. Rather than targeting a generic “shopper,” the team created three distinct personas based on historical data and customer interviews.
Persona A: The Seasonal Shopper
Typically shops during major sales events. Price-sensitive. Low engagement with brand content outside of promotions.
Persona B: The Brand Loyalist
Shops frequently regardless of sales. Values quality and consistency. High potential for advocacy if experience is smooth.
Persona C: The New Explorer
Just discovered the brand. Needs guidance and reassurance before committing to a second purchase.
By segmenting the audience, the team could map specific journeys for each group. This ensured that the retention strategy addressed the specific motivations of each type of buyer.
Phase 2: Mapping the Touchpoints 🗺️
With personas defined, the team visualized the end-to-end journey. This involved listing every interaction a customer has with the brand. The map was divided into five core stages:
- Awareness: How the customer finds the brand.
- Consideration: Researching products and comparing options.
- Purchase: The transaction process.
- Delivery: Receiving the product and unpacking.
- Post-Purchase: Usage, support, and potential repurchase.
The team gathered data from customer support logs, website analytics, and social media comments to populate this map. They focused heavily on the emotional state of the customer at each stage, not just the functional actions.
Key Findings from the Initial Map
During the mapping exercise, several critical friction points emerged that were previously invisible to the management team.
| Stage | Touchpoint | Pain Point Identified | Emotional Impact |
|---|---|---|---|
| Consideration | Product Page | Sizing charts were inconsistent across categories. | Anxiety |
| Purchase | Checkout | Hidden fees appeared at the final step. | Frustration |
| Delivery | Shipping Notification | Updates were delayed by 24 hours. | Impatience |
| Post-Purchase | Return Portal | Instructions were buried in the FAQ. | Confusion |
Phase 3: Analyzing Friction and Emotion 🔍
Identifying the friction points was only half the battle. The team needed to understand the underlying causes. They conducted follow-up interviews with customers who had churned. The feedback revealed that it wasn’t just about the product quality; it was about the trust built during the journey.
Example 1: The Sizing Anxiety
Customers were hesitant to buy multiple sizes to ensure a fit because the return process felt risky. They feared being charged for shipping or dealing with unresponsive support.
Example 2: The Delivery Black Hole
Once the order was placed, customers went dark. Without real-time updates, they assumed the package was lost or the process was failing. This lack of transparency killed the excitement of receiving a new item.
Example 3: The Post-Purchase Silence
After delivery, the brand went silent for weeks. There was no check-in to see if the product was working or if the customer needed help. This signaled to the customer that the relationship ended at the sale.
Phase 4: Strategic Implementation 🛠️
Based on the insights, the retailer developed a series of targeted interventions. These changes were implemented across digital and physical channels without upgrading to new technology stacks. The focus was on process and communication.
1. Standardizing Product Information
The team audited all product pages to ensure sizing guides were consistent. They added user-generated photos showing fit on different body types. This reduced the anxiety associated with online sizing.
2. Transparent Checkout Process
All taxes and shipping costs were displayed on the product page and in the cart, not just at the final checkout step. This eliminated the “sticker shock” that often leads to cart abandonment and subsequent distrust.
3. Proactive Delivery Updates
Instead of waiting for the carrier to update the status, the system began pushing notifications at key milestones: Order Confirmed, Shipped, Out for Delivery, and Delivered. This kept the customer informed without them needing to ask.
4. The Welcome Back Program
A new post-purchase email sequence was introduced. It did not immediately ask for a sale. Instead, it focused on value:
- Day 1: Confirmation and care instructions.
- Day 5: How to style the item.
- Day 30: A check-in asking if they needed anything.
- Day 60: A personalized recommendation based on the original purchase.
5. Simplified Returns
The return policy was rewritten to be plain language. A QR code was added to the packing slip, allowing customers to print a label instantly from their phone without logging into an account.
Phase 5: Measuring the Results 📊
After six months of implementing these journey improvements, the retailer analyzed the data to determine the impact. The goal was to increase retention without sacrificing the acquisition rate.
The results were significant across key performance indicators:
- Repeat Purchase Rate: Increased by 22% compared to the previous year.
- Customer Satisfaction Score (CSAT): Rose from 3.5 to 4.6 out of 5.
- Return Processing Time: Reduced by 40% due to the simplified portal.
- Email Engagement: Open rates on post-purchase emails improved by 15%.
- Net Promoter Score (NPS): Improved by 18 points.
Key Takeaways for Retailers 🧠
This case study demonstrates that journey mapping is not just a theoretical exercise; it is a practical tool for business growth. Other retailers can apply these lessons to their own operations.
1. Data Must Be Actionable
Collecting data is useless if it does not lead to change. The retailer did not just create a map; they acted on the friction points identified within it.
2. Emotions Drive Decisions
Customers do not buy based on logic alone. They buy based on how they feel. Reducing anxiety and frustration during the journey is just as important as lowering prices.
3. Consistency Across Channels
Whether a customer shops online or in-store, the experience should be seamless. Disconnected channels create confusion and erode trust.
4. Silence is a Signal
After a purchase, silence feels like abandonment. Maintaining communication, even if it is just informational, keeps the brand top-of-mind.
5. Iteration is Necessary
The journey map was not a one-time document. The team reviewed it quarterly to account for seasonal changes and new customer behaviors.
Common Pitfalls to Avoid ⚠️
While the retailer succeeded, many organizations struggle with similar initiatives. Here are common mistakes to watch out for when implementing your own strategy.
- Mapping the Process, Not the Person: Focusing on what the company does rather than what the customer experiences.
- Ignoring Negative Feedback: Only looking at happy customers to create the map.
- Overcomplicating the Map: Creating a document so complex that stakeholders cannot understand or use it.
- Failing to Share: Keeping the map in one department instead of sharing it with customer support, marketing, and logistics.
Building a Culture of Customer Centricity 🌱
Ultimately, the success of this initiative came from a shift in company culture. The leadership team made customer experience a core value, not just a marketing tactic. When employees understand how their specific role impacts the customer journey, they make better decisions.
For example, the logistics team became more responsive to delivery inquiries because they saw how delays affected the customer’s emotional state. The design team paid closer attention to the checkout flow because they understood how friction impacted conversion. This alignment is the true power of journey mapping.
Conclusion 🏁
Improving retention in retail requires more than discounts and loyalty points. It requires a deep understanding of the customer’s path. By mapping the journey, identifying friction, and implementing targeted changes, this retailer transformed their relationship with their customers. The result was not just higher numbers, but a stronger brand reputation and a more loyal community.
For any organization looking to reduce churn, the first step is to look at the journey. Ask where the customer feels stuck, where they feel confused, and where they feel delighted. Then, take action to fix the former and amplify the latter. This is the foundation of sustainable growth.

