Introduction
A PERT chart helps turn a project plan into a clear network of activities, dependencies, and parallel work. By showing how tasks connect—and identifying the critical path—it can help teams understand what needs to happen, where delays may affect the finish date, and how much flexibility the schedule has. This guide covers the core PERT concepts, a worked example in PlantUML, and ways to create and manage charts with Visual Paradigm’s PERT tooling, AI-assisted diagram generation, and VPasCode.
A PERT chart (Program Evaluation and Review Technique) is a network diagram for planning project work. It shows activities, their dependencies, and the sequence of work that determines the earliest possible project finish. Unlike a calendar-based Gantt chart, a PERT chart emphasizes what must happen before what and which tasks can proceed in parallel.
Key concepts
-
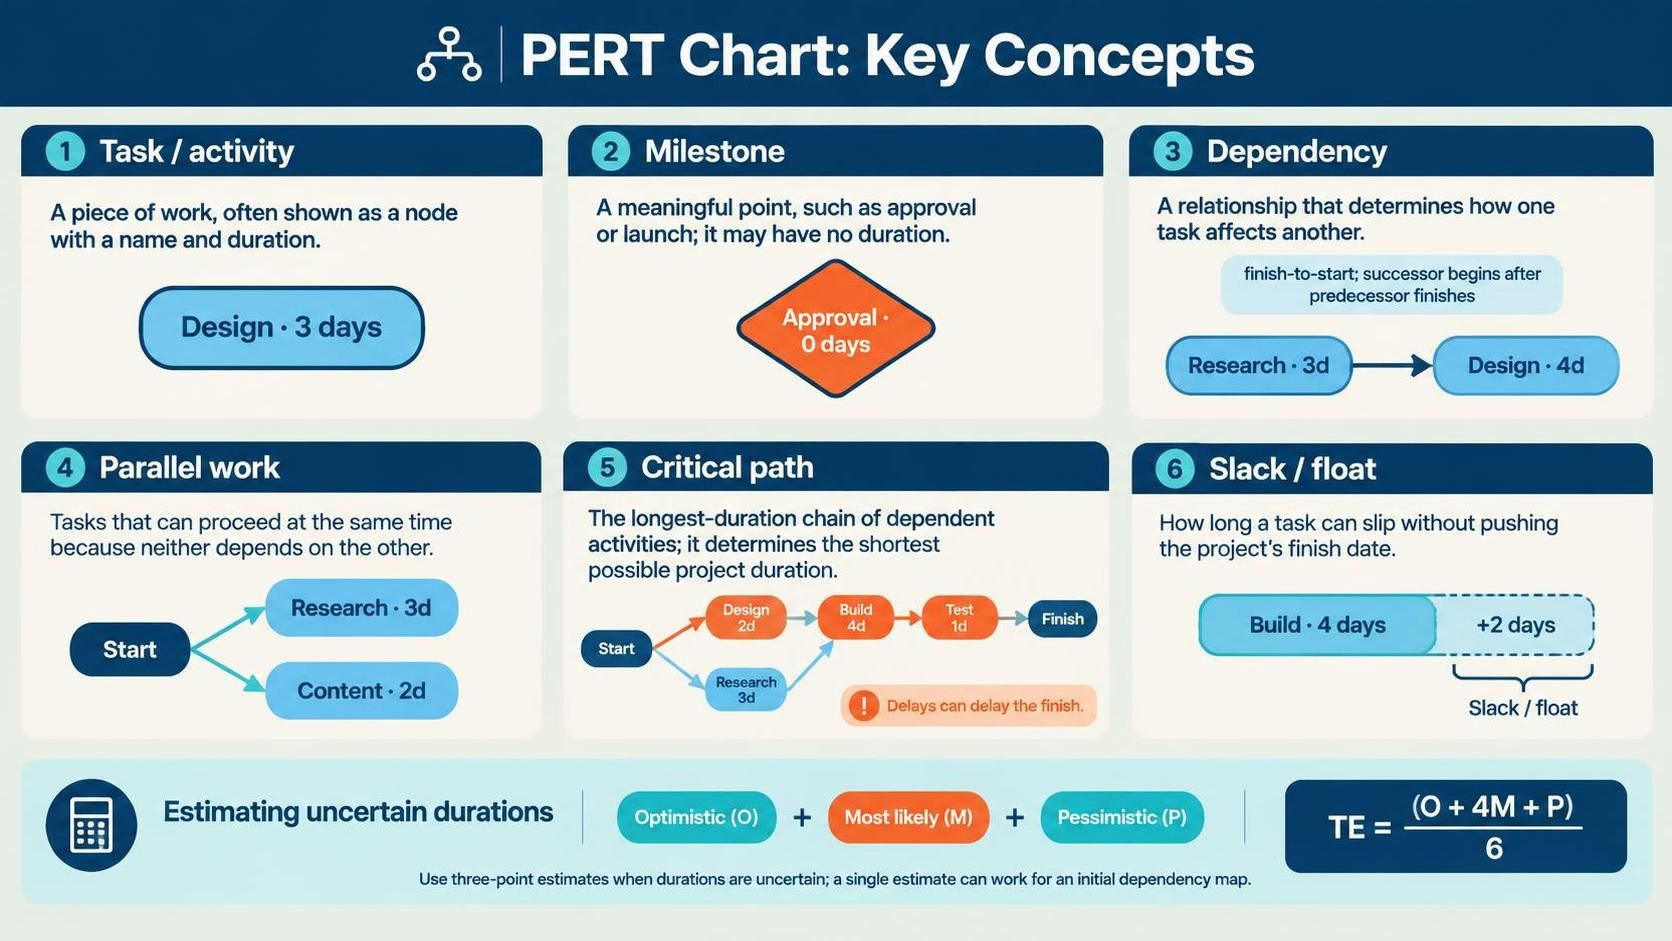
Task or activity: A piece of work, often shown as a node with a name and duration.
-
Milestone: A meaningful point in the project, such as approval or launch; it may have no duration.
-
Dependency: A relationship that determines how one task affects another. A common relationship is finish-to-start: the successor task begins after its predecessor finishes.
-
Parallel work: Tasks that can proceed at the same time because neither depends on the other.
-
Critical path: The longest-duration chain of dependent activities. It determines the shortest possible project duration; delays to tasks on this path can delay the project.
-
Slack or float: How long a task can slip without pushing the project’s finish date.
Traditional PERT estimation can account for uncertainty with three duration estimates: optimistic (O), most likely (M), and pessimistic (P). The expected duration is (TE=(O+4M+P)/6). Use this when estimates are uncertain; a simple single duration can be enough for an initial dependency map.
Visual Paradigm PERT tooling
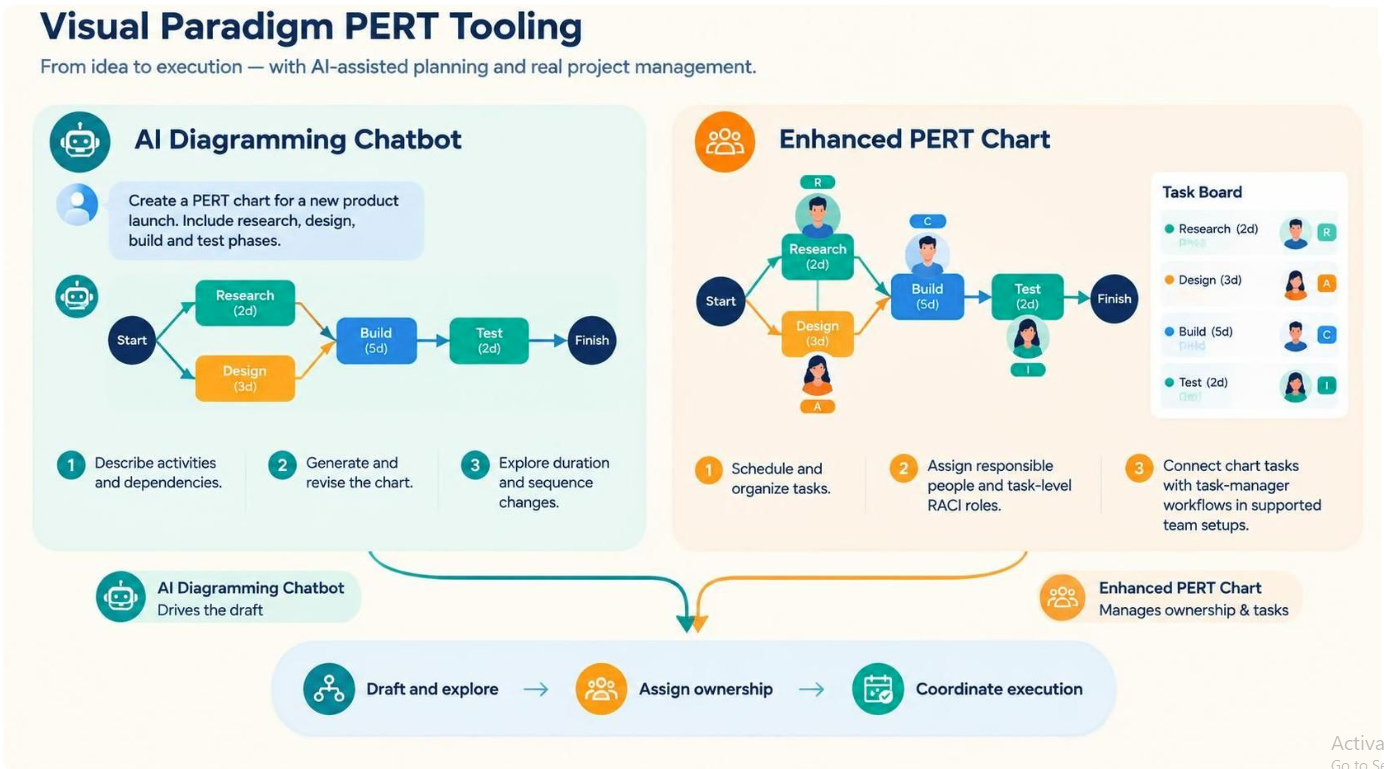
Visual Paradigm’s Enhanced PERT Chart is designed to schedule and organize tasks, and adds connections to team and task-management workflows. In supported team setups, you can assign responsible people, specify task-level RACI roles, and synchronize the chart’s tasks with the task manager. The product describes tasks appearing in the responsible member’s list, with subsequent RACI roles involved according to the task’s flow.
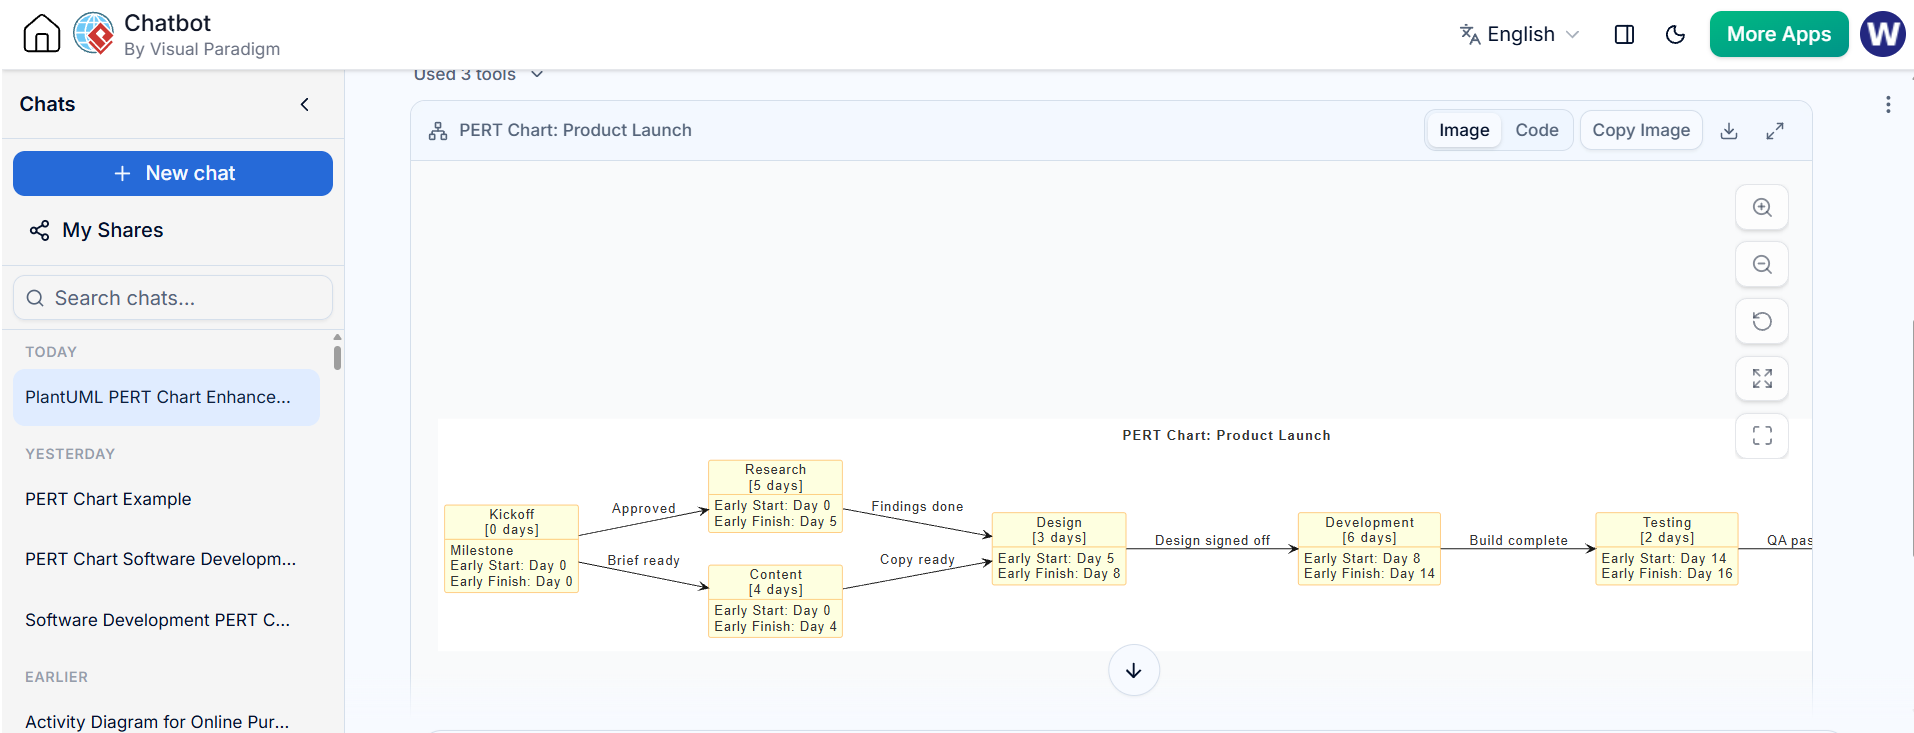
The AI Diagramming Chatbot offers a conversational way to create and revise a PERT chart. Describe the project, activities, and how tasks depend on each other; the chatbot generates a diagram, and you can ask it to add activities, change durations, or explore alternative sequences.
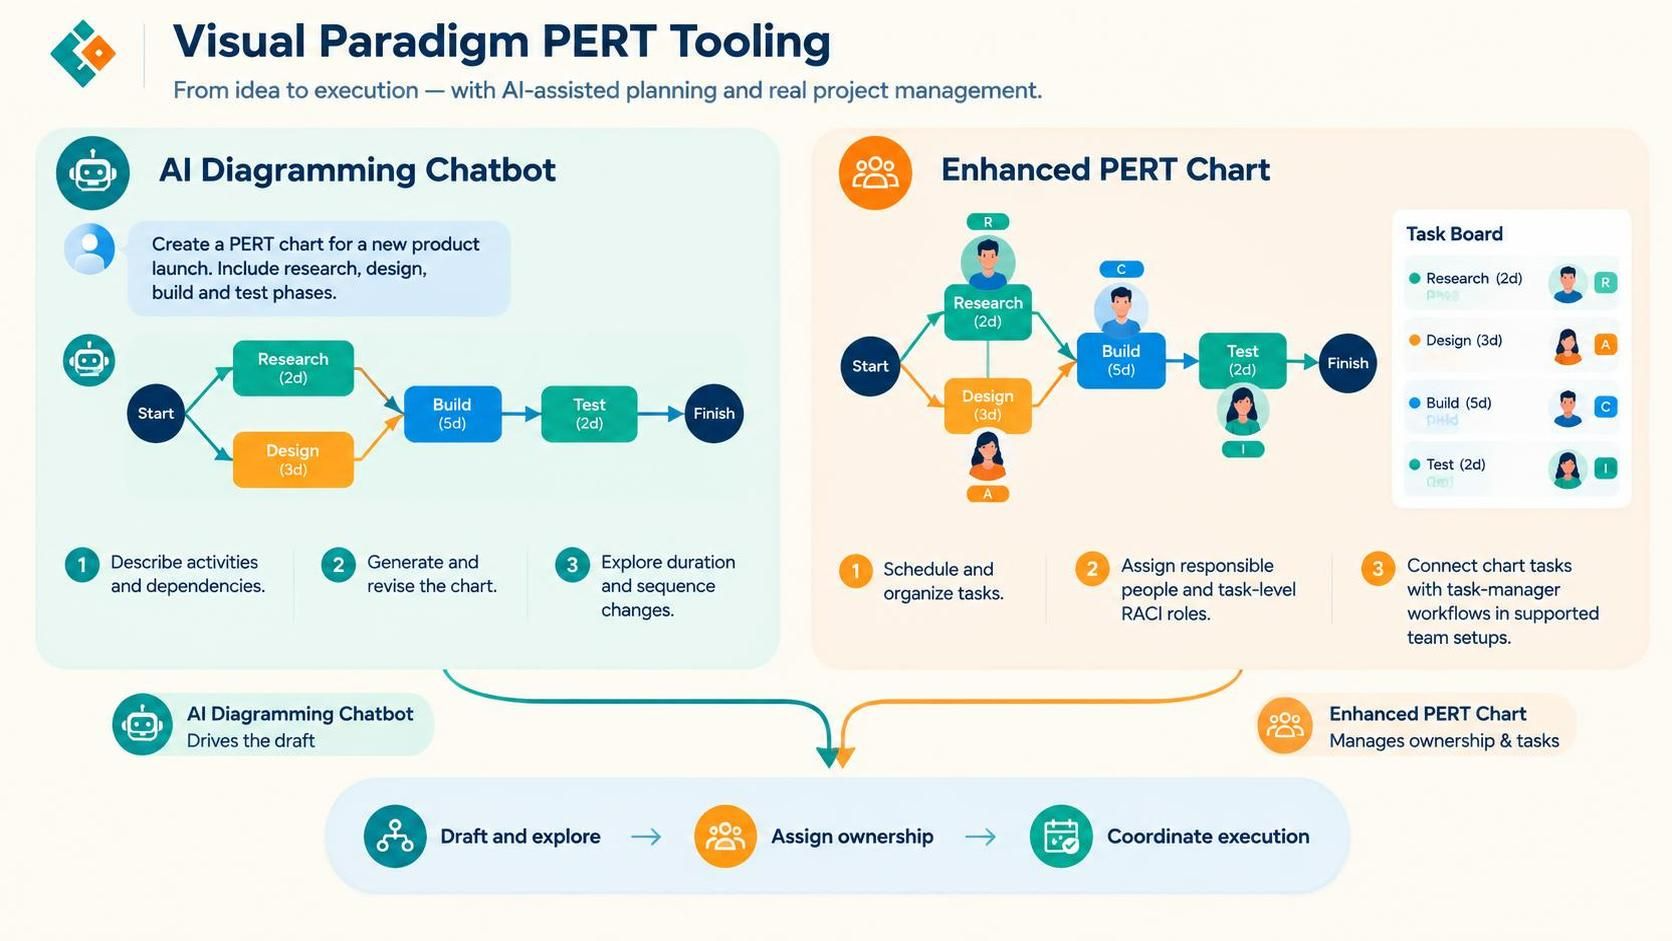
These are complementary approaches: the chatbot helps you draft and explore the network; the Enhanced PERT workflow connects planning with ownership, RACI, and task execution.
Example project and PlantUML code
Here is a small website-launch plan. Research and content work can begin after kickoff in parallel. Design needs both research and content; development follows design; testing follows development.
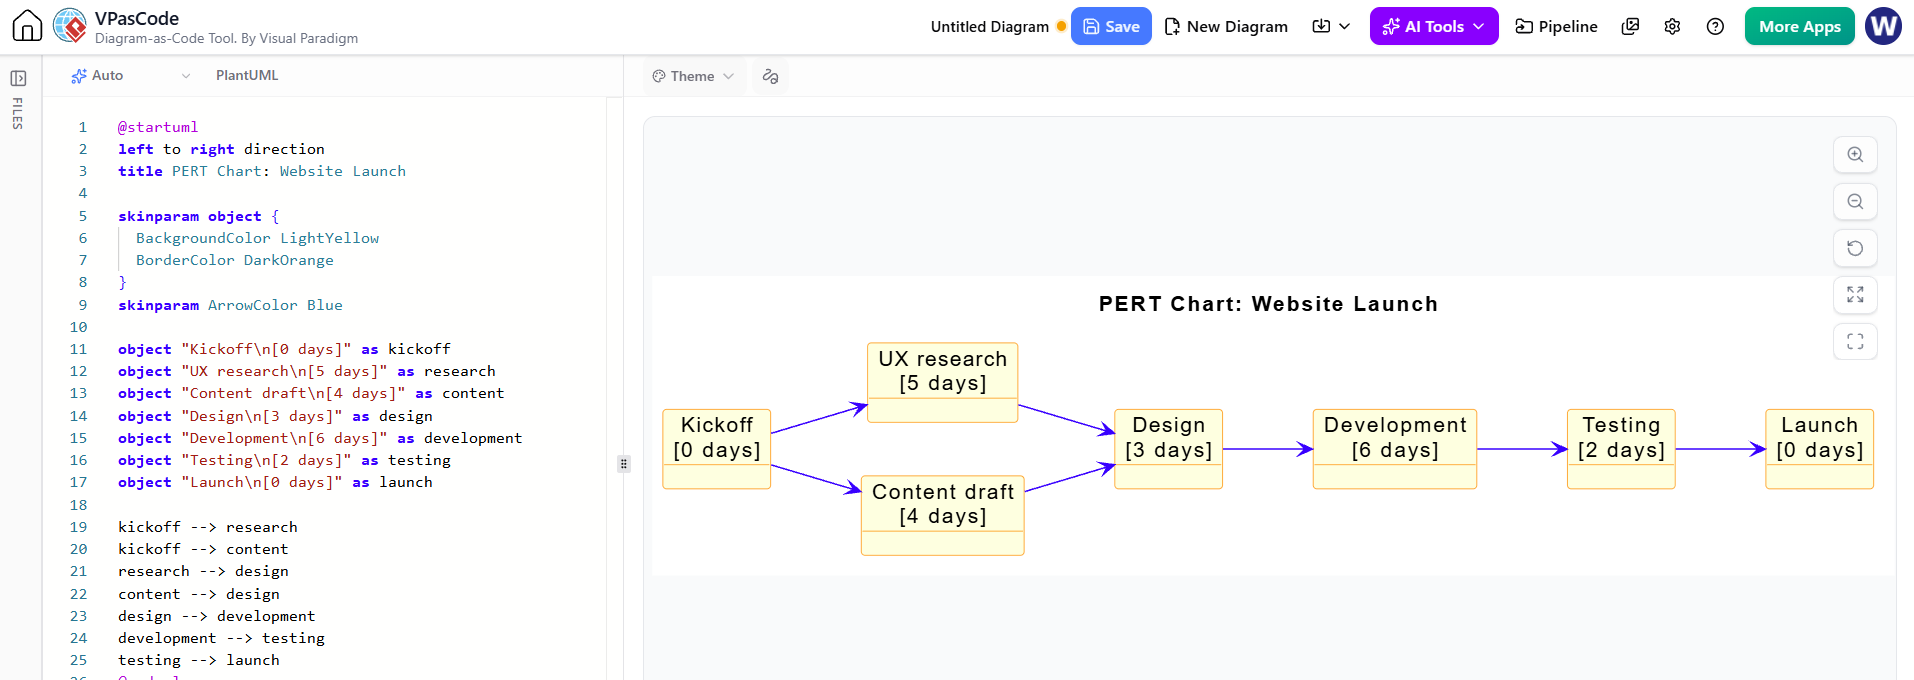
@startuml
left to right direction
title PERT Chart: Website Launch

skinparam object {
  BackgroundColor LightYellow
  BorderColor DarkOrange
}
skinparam ArrowColor Blue

object "Kickoff\n[0 days]" as kickoff
object "UX research\n[5 days]" as research
object "Content draft\n[4 days]" as content
object "Design\n[3 days]" as design
object "Development\n[6 days]" as development
object "Testing\n[2 days]" as testing
object "Launch\n[0 days]" as launch

kickoff --> research
kickoff --> content
research --> design
content --> design
design --> development
development --> testing
testing --> launch
@enduml
PlantUML does not have a dedicated @startpert directive. This example uses an ordinary @startuml block and object-diagram syntax to represent activities as nodes and dependencies as arrows. PlantUML renders the diagram, but it does not automatically calculate schedule dates, slack, or the critical path. Treat schedule values as manually calculated annotations, and recalculate them whenever a duration or dependency changes.
For this example, the route through research takes (5+3+6+2=16) days. The route through content takes (4+3+6+2=15) days. So the research route is critical, and the estimated project duration is 16 working days, assuming the stated dependencies and durations. “Day 0” or “Day 1” conventions can shift displayed date labels, so state which convention you use.
Creating a chart with AI
Start with a description that names the work and spells out dependencies. For example:
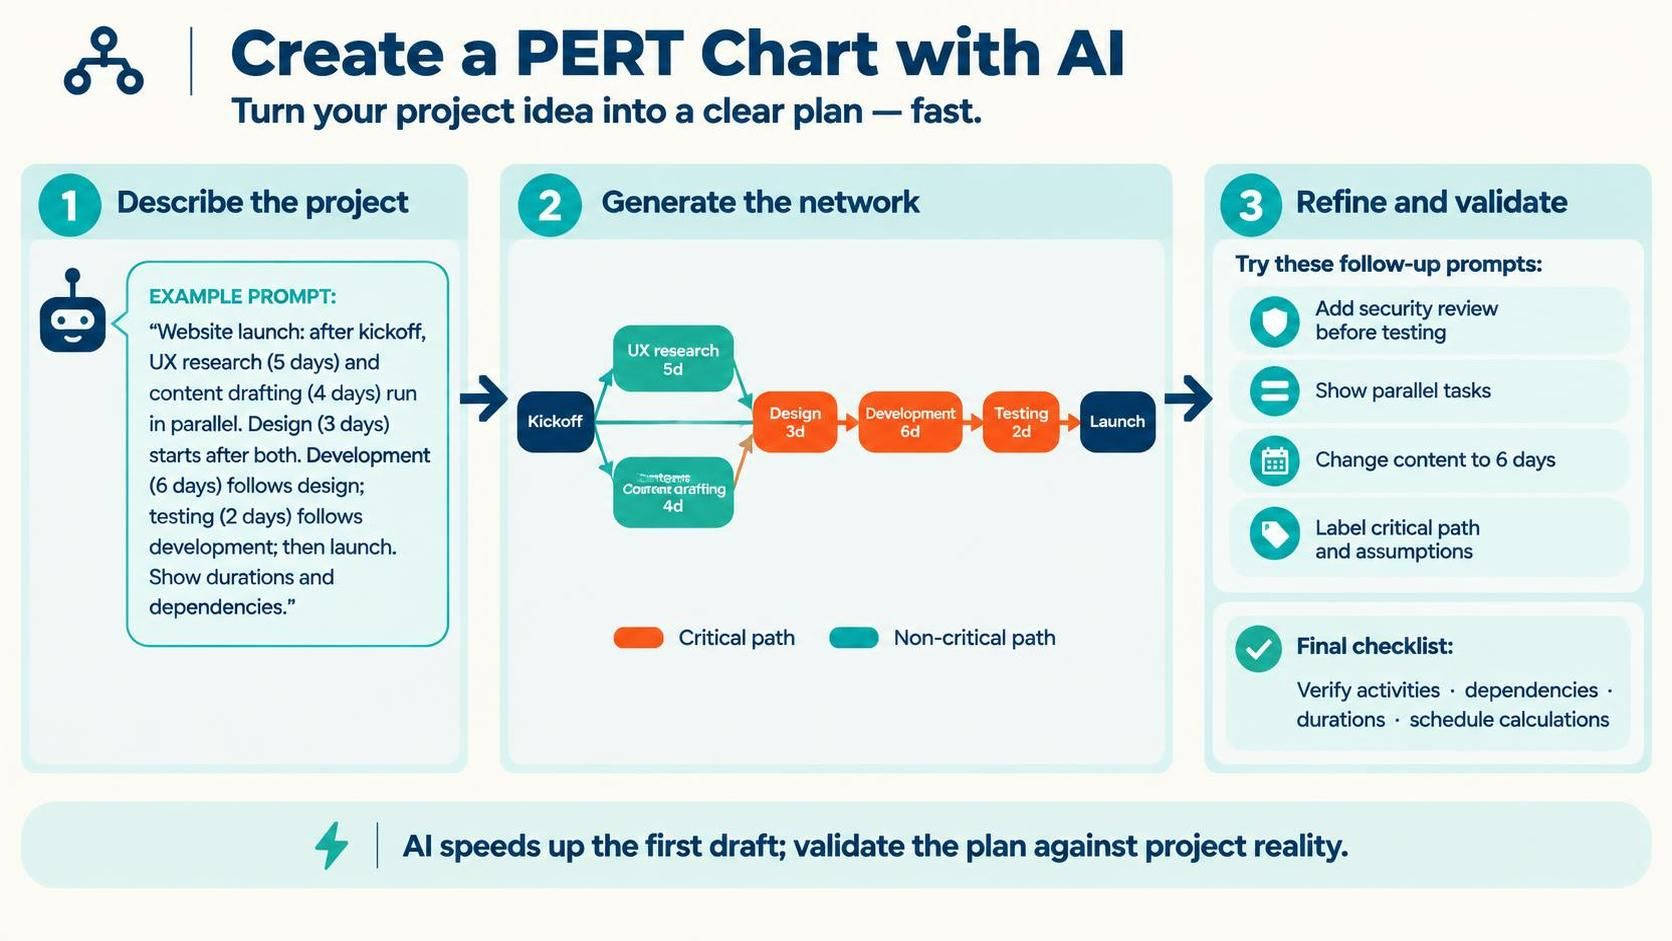
Create a PERT chart for a website launch. After kickoff, UX research takes 5 days and content drafting takes 4 days; these can run in parallel. Design takes 3 days and starts after both are complete. Development takes 6 days after design, testing takes 2 days after development, then launch. Show each task’s duration and the dependencies.
Then review the generated chart and refine it conversationally. Useful follow-up prompts include:
-
“Add a security review after development and before testing.”
-
“Show which tasks can happen in parallel.”
-
“Change content drafting to 6 days and explain how that affects the schedule.”
-
“Label the critical path, but distinguish calculated results from assumptions.”
The chatbot describes generating diagrams from project descriptions and making step-by-step adjustments through conversation. Still, validate the tasks, links, and any schedule conclusions against the actual project plan.
Benefits
-
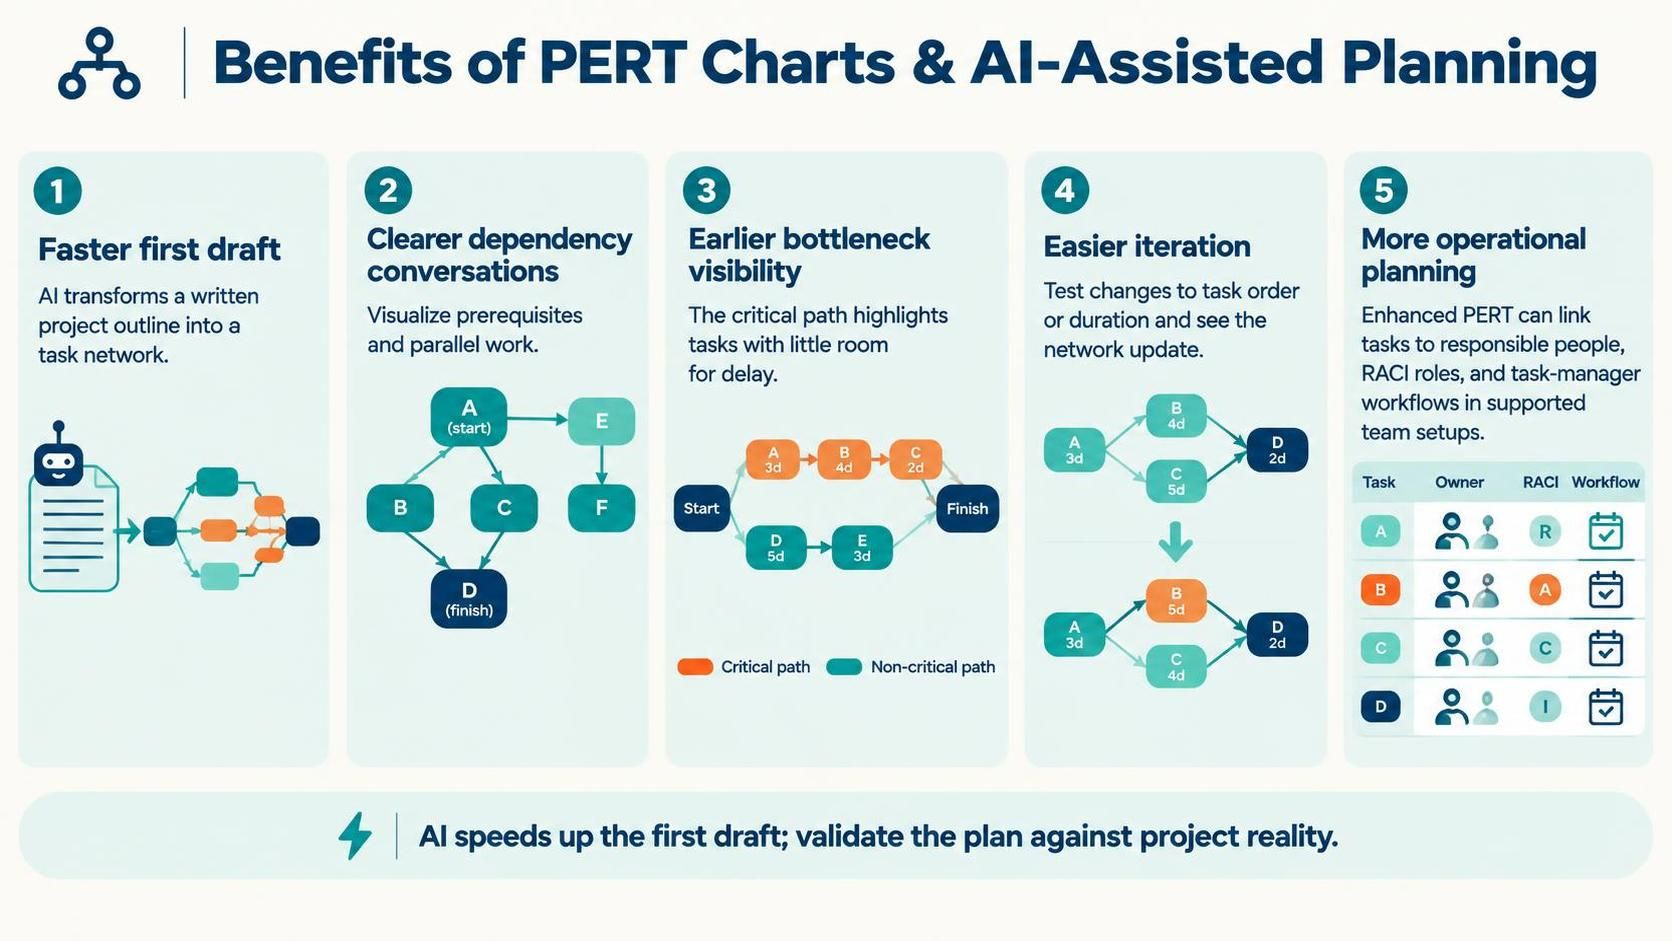
Faster first draft: AI can turn a written project outline into a visible task network without manually drawing every node and connection.
-
Clearer dependency conversations: A network makes prerequisites and parallel work easier to discuss.
-
Earlier bottleneck visibility: The critical path helps identify activities that have little or no room for delay.
-
Easier iteration: You can test changes to task order or duration and inspect how the network changes.
-
More operational planning: Enhanced PERT can connect the plan to responsible people, RACI roles, and task-manager workflows in supported Visual Paradigm team setups.
What stands out
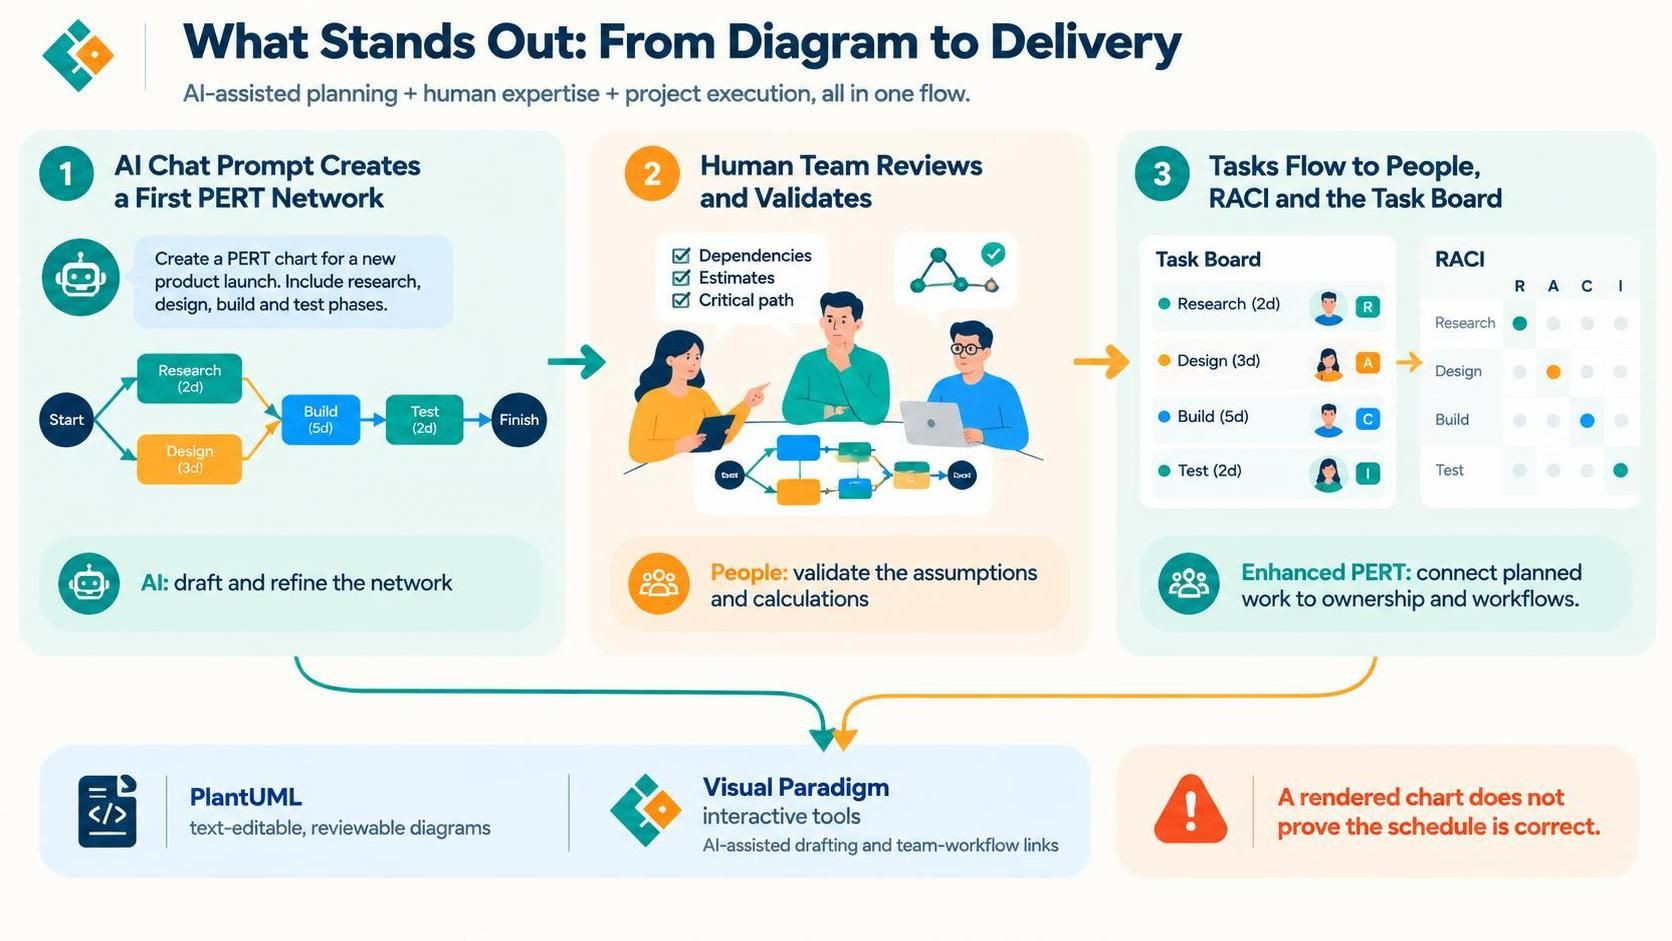
The distinctive feature is the combination of conversational chart creation and project-execution integration. AI helps make a first network quickly and refine it by asking for changes; the Enhanced PERT tool adds the potential to connect planned work to people, RACI responsibilities, and task management. That makes it more than a diagramming exercise: it can support the transition from a project’s dependency plan to assigned work.
For a reliable schedule, however, keep the human review step: confirm dependencies, estimates, and critical-path calculations rather than assuming a rendered chart proves the schedule is correct. PlantUML is especially useful when you want a text-editable, reviewable diagram; Visual Paradigm’s interactive tools are a stronger fit when you want AI-assisted drafting or links to team workflows.
Tooling: Visual Paradigm PERT Chart, AI Assistance, and VPasCode
Visual Paradigm offers three complementary ways to create and work with PERT charts: a structured PERT modeler for project planning, AI-assisted generation for quickly drafting a network from a description, and VPasCode for creating a text-based, editable diagram. They serve different stages of the workflow rather than being interchangeable tools.
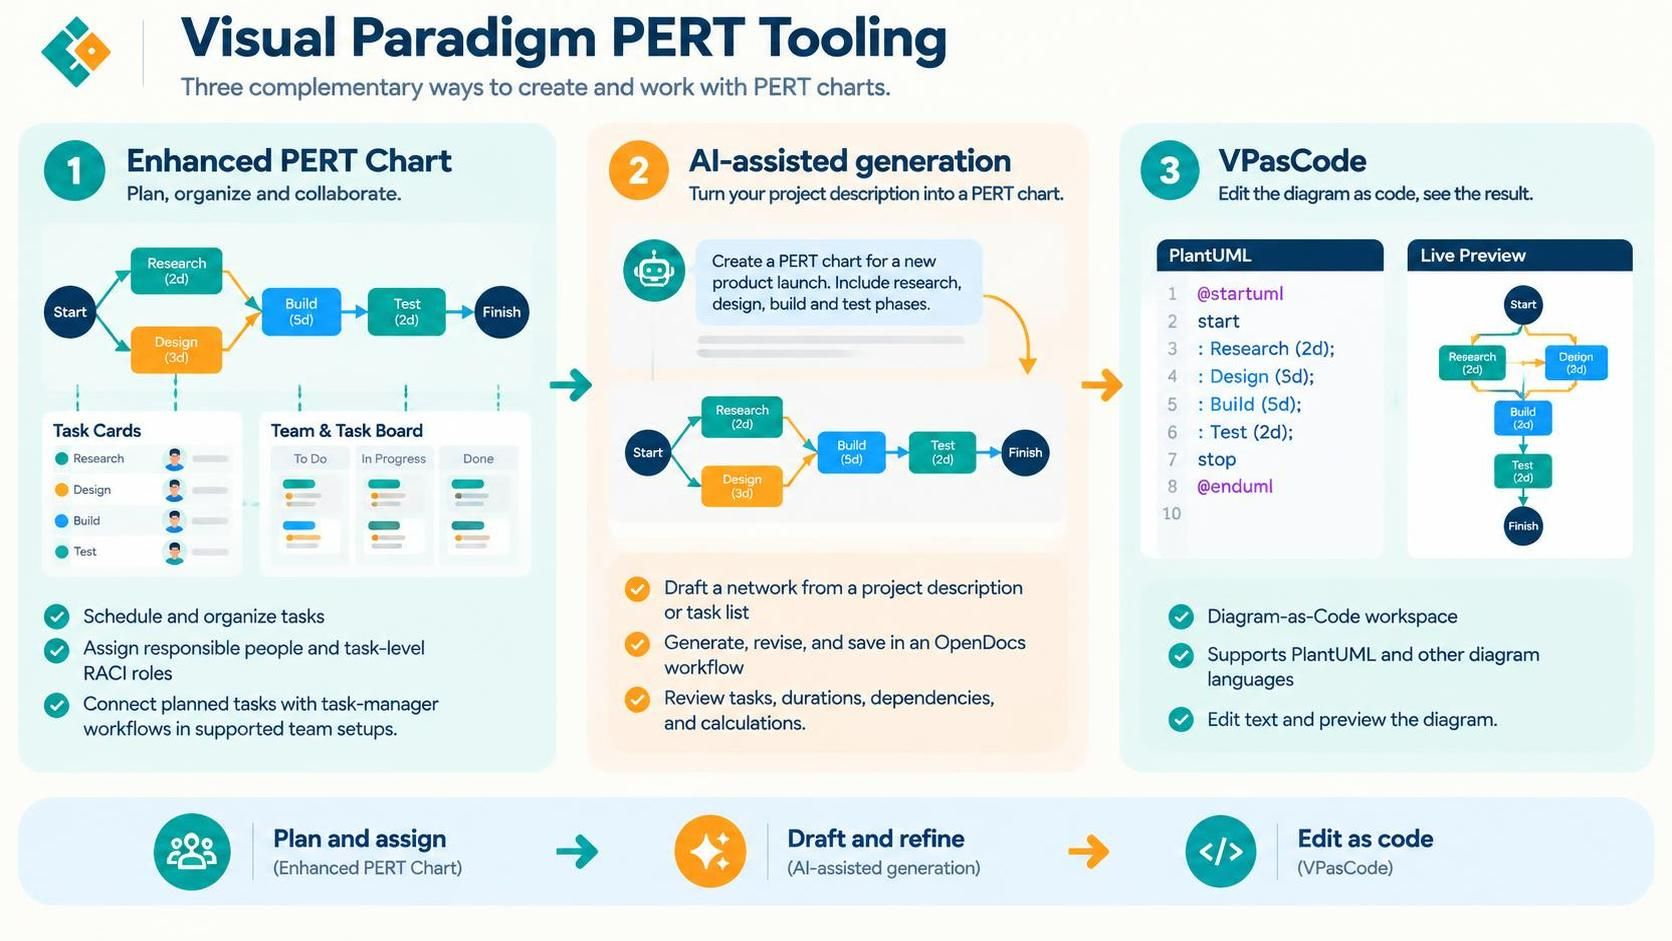
Visual Paradigm PERT Chart. The Enhanced PERT Chart tool supports task scheduling and organization, with options to assign a responsible person, define task-level RACI roles, and synchronize planned tasks with Visual Paradigm’s task manager. In supported team setups, tasks can be generated for the assigned members and move through the relevant RACI flow as work is completed. This makes the PERT chart useful not only for mapping dependencies, but also for connecting a schedule baseline to ownership and execution.
AI-assisted PERT creation. Visual Paradigm’s AI Diagram Generator can create a PERT chart from a project description or task list, interpreting the described phases and sequence to build a network diagram. The AI-assisted flow is useful for producing a first draft quickly; review the generated activities, durations, dependencies, and schedule calculations before relying on them. For an OpenDocs workflow, the documented steps are to insert a PERT chart, choose Create with AI, describe the project, generate and edit the diagram, then save it into the document.
VPasCode. VPasCode is Visual Paradigm’s Diagram-as-Code workspace. It supports PlantUML, along with other diagram languages, and provides a live preview as you edit the source. That makes it a good choice when you want a PERT-style network that is easy to revise as text, share for review, or keep alongside other technical artifacts.
For example, PlantUML can represent tasks as nodes and dependencies as arrows:
@startuml
skinparam vpDiagramType PERTChart
skinparam defaultFontSize 14
skinparam defaultFontColor #333333
left to right direction
title PERT Chart: Product Launch

skinparam object {
    BackgroundColor LightYellow
    BorderColor DarkOrange
}

object "Kickoff\n[0 days]" as kickoff {
  Milestone
  Early Start: Day 0
  Early Finish: Day 0
}

object "Research\n[5 days]" as research {
  Early Start: Day 0
  Early Finish: Day 5
}

object "Content\n[4 days]" as content {
  Early Start: Day 0
  Early Finish: Day 4
}

object "Design\n[3 days]" as design {
  Early Start: Day 5
  Early Finish: Day 8
}

object "Development\n[6 days]" as development {
  Early Start: Day 8
  Early Finish: Day 14
}

object "Testing\n[2 days]" as testing {
  Early Start: Day 14
  Early Finish: Day 16
}

object "Launch\n[0 days]" as launch {
  Milestone
  Early Start: Day 16
  Early Finish: Day 16
}

kickoff --> research : "Approved"
kickoff --> content : "Brief ready"
research --> design : "Findings done"
content --> design : "Copy ready"
design --> development : "Design signed off"
development --> testing : "Build complete"
testing --> launch : "QA passed"
@enduml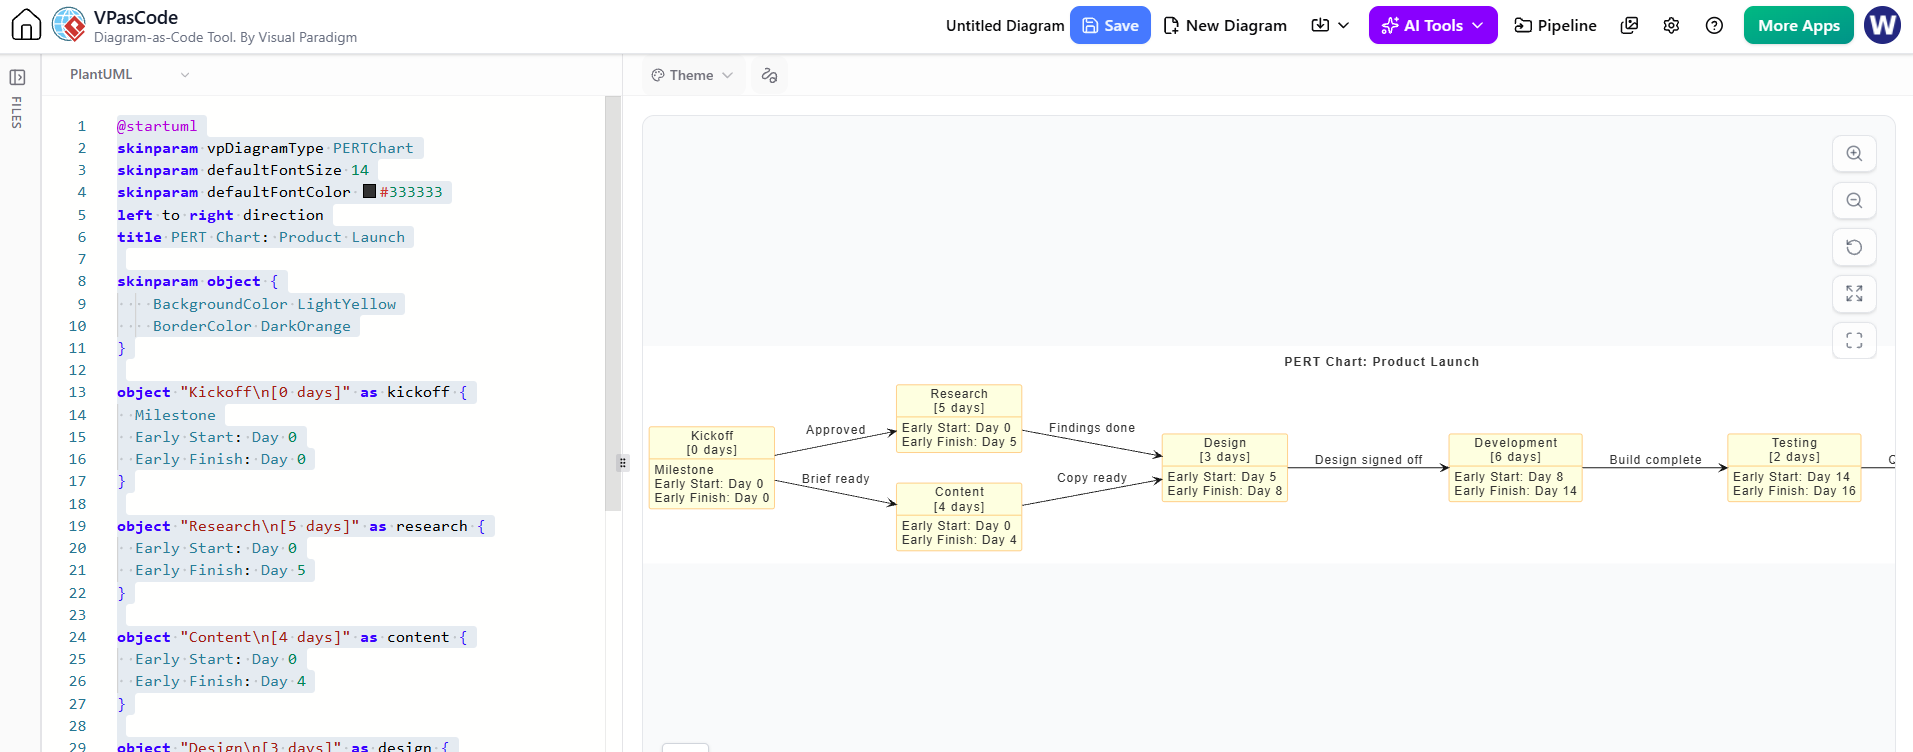

PlantUML provides the diagram syntax and rendering; the example does not automatically calculate a critical path or slack. If you need those results, calculate them separately and check them against the project’s actual assumptions.
A practical workflow: use AI to turn a written outline into a draft; validate the task list, dependencies, and estimates with the project team; refine the network in the PERT modeler if you need assignments, RACI, or task-manager integration; and use VPasCode when a text-based diagram is the better fit for editing and review.
Conclusion
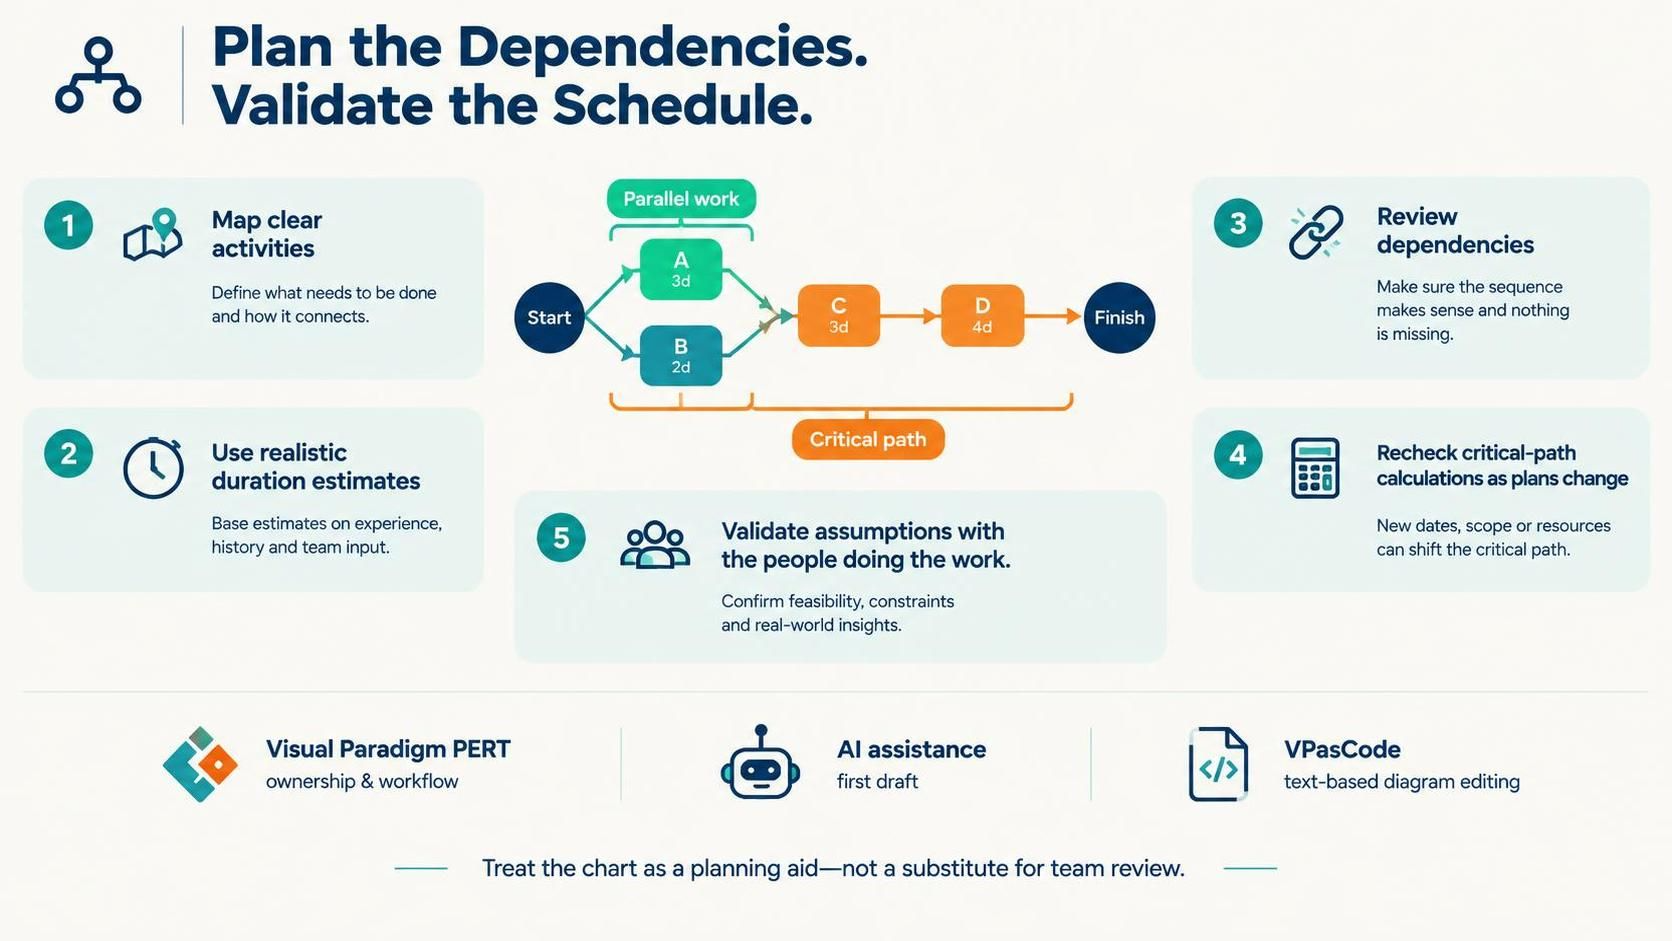
PERT charts are most useful when a team needs to understand the logic behind a project schedule: which tasks depend on others, which can happen in parallel, and which sequence sets the earliest possible finish. Start with clear activities and realistic duration estimates, then review the dependencies and critical-path calculations as the plan changes. Visual Paradigm’s PERT tool can connect planning with task ownership and workflow; AI assistance can help create a first draft; and VPasCode offers a text-based way to build and revise a diagram. Whichever tool you use, treat the chart as a planning aid and validate its assumptions with the people doing the work.