
Introduction
Project management is often a balancing act between scope, time, and resources. Among the various methodologies available, the Program Evaluation and Review Technique (PERT) stands out as a powerful tool for scheduling, organizing, and coordinating tasks within complex projects. Traditionally, creating a PERT chart required meticulous manual plotting of nodes, dependencies, and time estimates—a process that was both time-consuming and prone to human error.
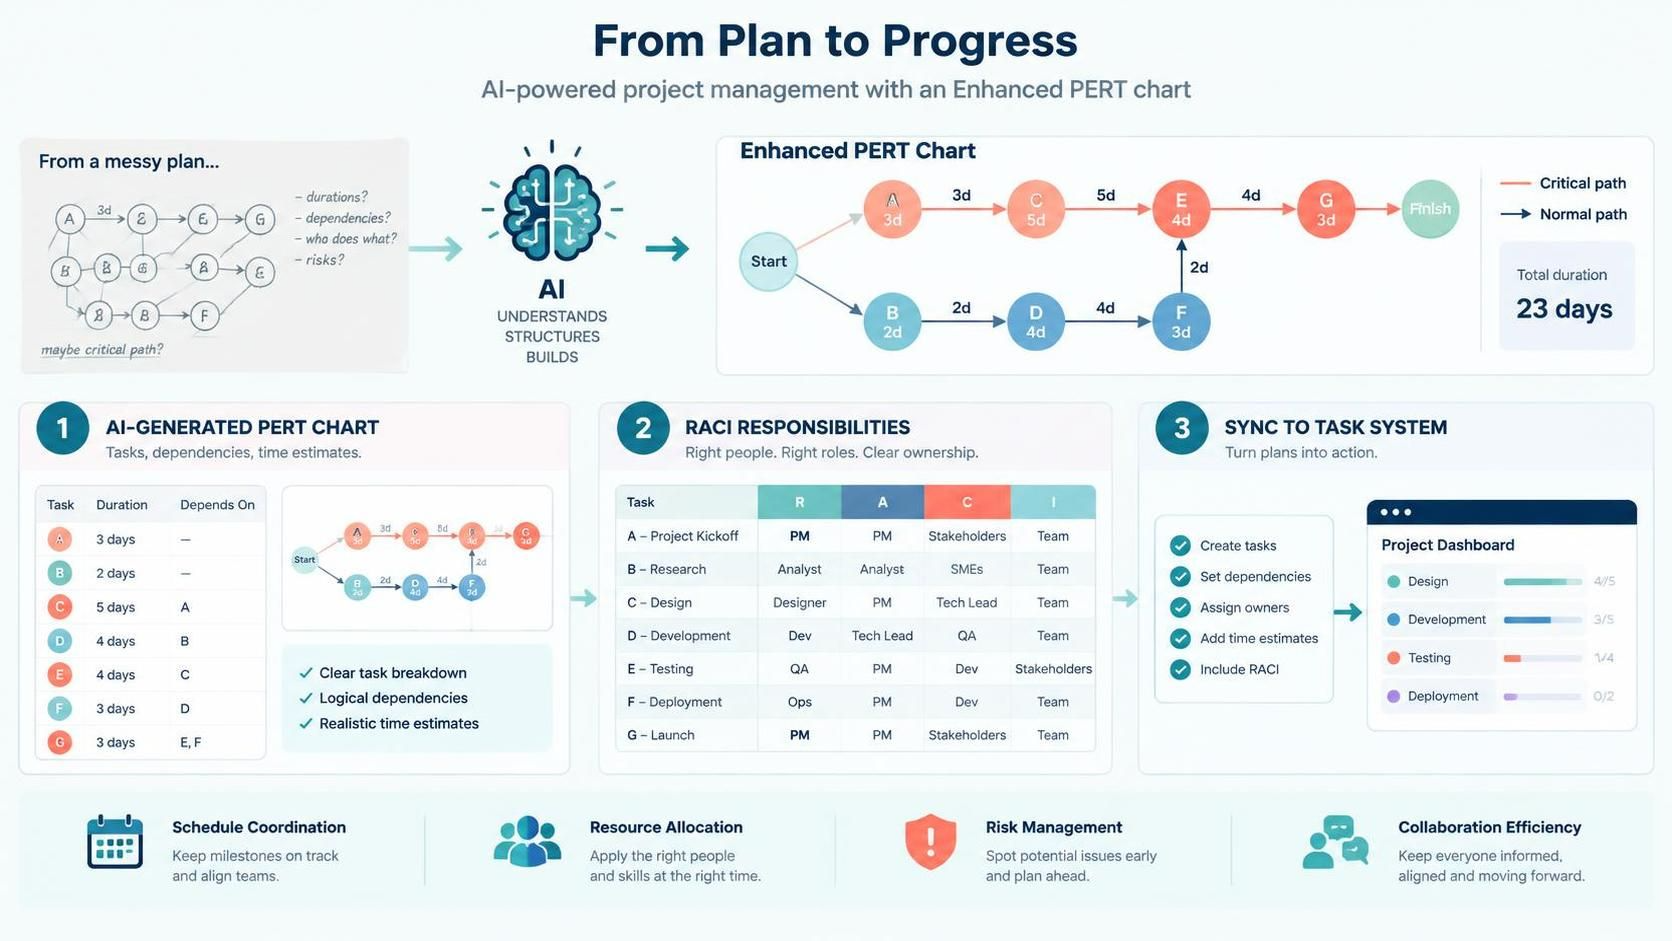
Visual Paradigm has revolutionized this workflow by introducing an Enhanced PERT Chart tool integrated with artificial intelligence. This guide explores how modern project managers can leverage Visual Paradigm’s AI-powered diagramming capabilities to instantly generate professional PERT charts, assign responsibilities using RACI matrices, and synchronize plans directly into task management systems. By shifting the focus from manual diagram construction to strategic resource allocation and risk management, teams can accelerate project timelines and improve collaboration efficiency.
Key Concepts
Before diving into the tooling, it is essential to understand the core concepts that drive the Enhanced PERT Chart methodology.
1. The Critical Path
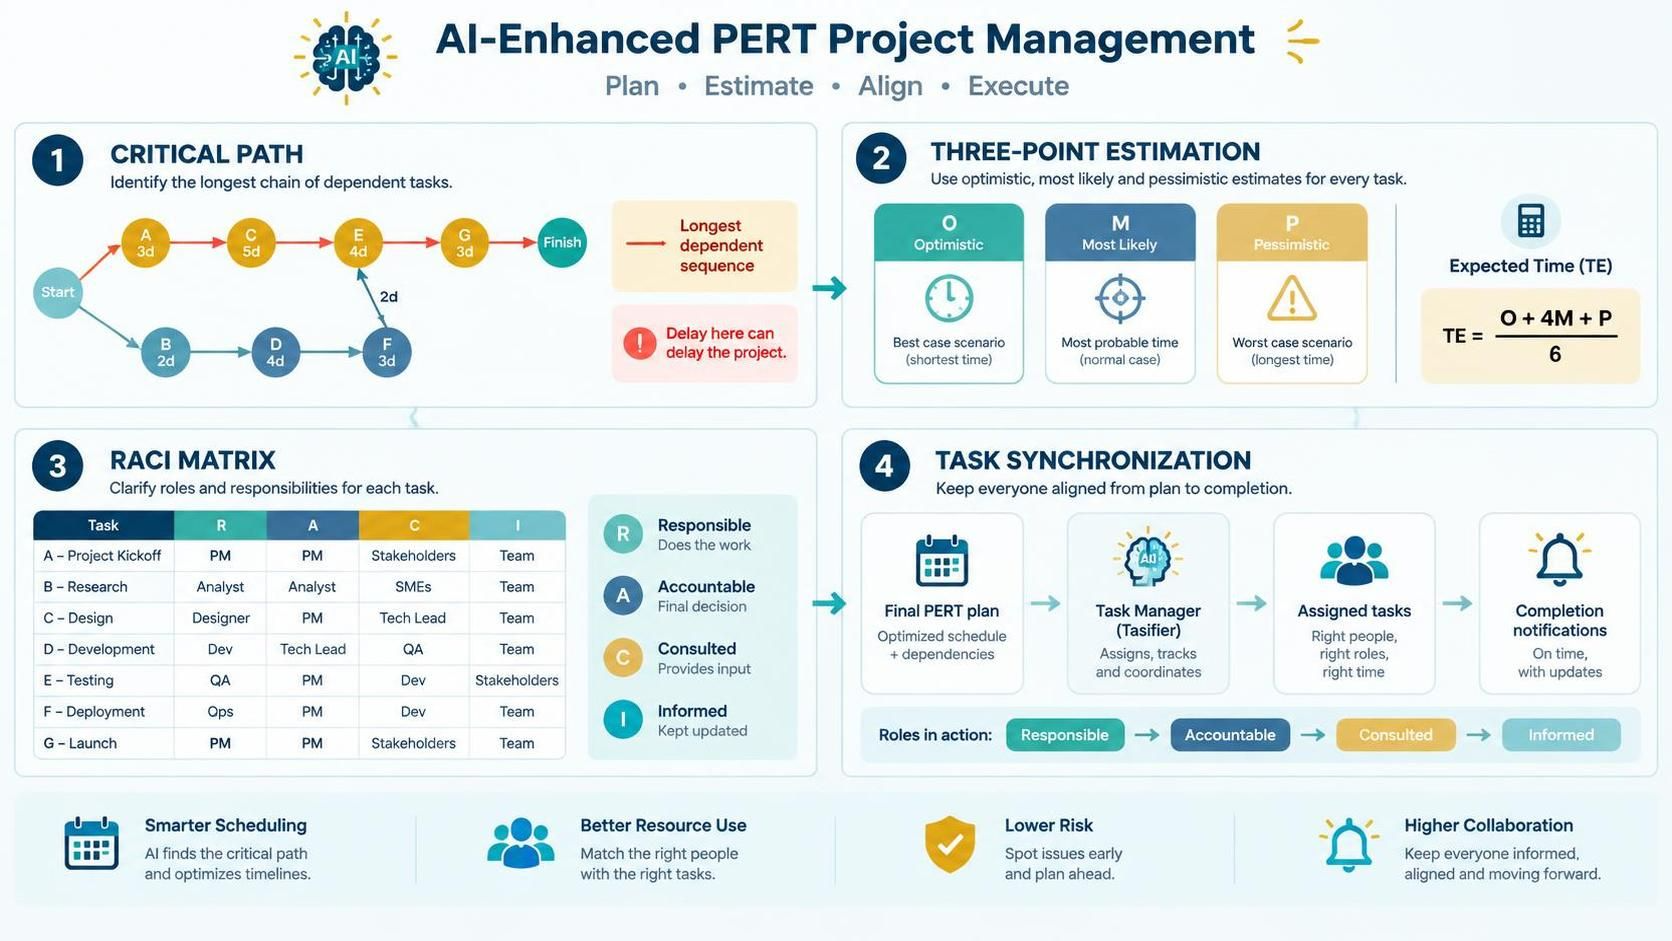
The critical path is the longest sequence of dependent tasks in a project plan that must be completed on time for the project to meet its deadline. Any delay in a critical path task directly impacts the project completion date. Visual Paradigm’s AI automatically calculates and highlights this path, allowing managers to prioritize high-risk activities.
2. Three-Point Estimation (O, M, P)
PERT charts rely on probabilistic time estimates rather than single-point guesses. For each task, three durations are considered:
-
Optimistic (O): The best-case scenario if everything goes perfectly.
-
Most Likely (M): The realistic estimate under normal conditions.
-
Pessimistic (P): The worst-case scenario if significant issues arise.
The expected time ($TE$) is calculated using the formula:
$$TE = \frac{O + 4M + P}{6}$$
3. RACI Matrix Integration
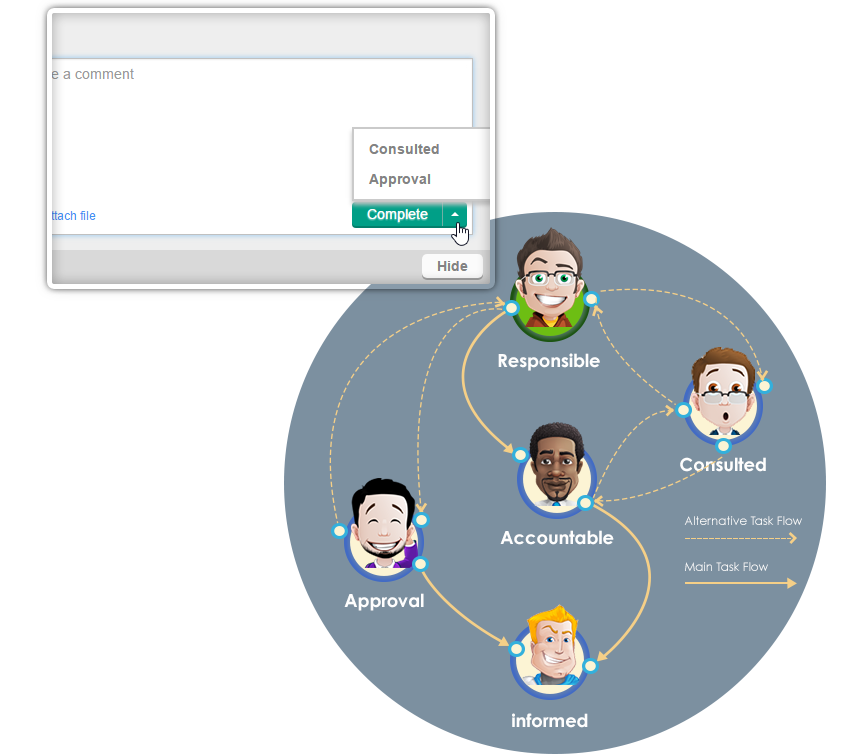
RACI stands for Responsible, Accountable, Consulted, and Informed. In traditional PERT charts, tasks are often just boxes with dates. In Visual Paradigm’s enhanced model, each task is associated with specific team members and their roles. This ensures clarity on who executes the work, who approves it, who provides input, and who needs to be kept in the loop.
4. Task Synchronization
The bridge between planning and execution is synchronization. Once a PERT chart is finalized, it can be pushed to Visual Paradigm’s Task Manager (Tasifier). Tasks are automatically assigned to the “Responsible” parties. As tasks are marked complete, the workflow triggers notifications or actions for those who are “Accountable,” “Consulted,” or “Informed,” creating a dynamic, living project plan.
Tooling: Visual Paradigm + AI Chatbot + AI PERT Chart Generator
Visual Paradigm combines robust diagramming standards with generative AI to streamline the creation of PERT charts. The workflow is designed to minimize manual entry and maximize strategic oversight.
Step-by-Step Workflow
1. Open the AI Tool
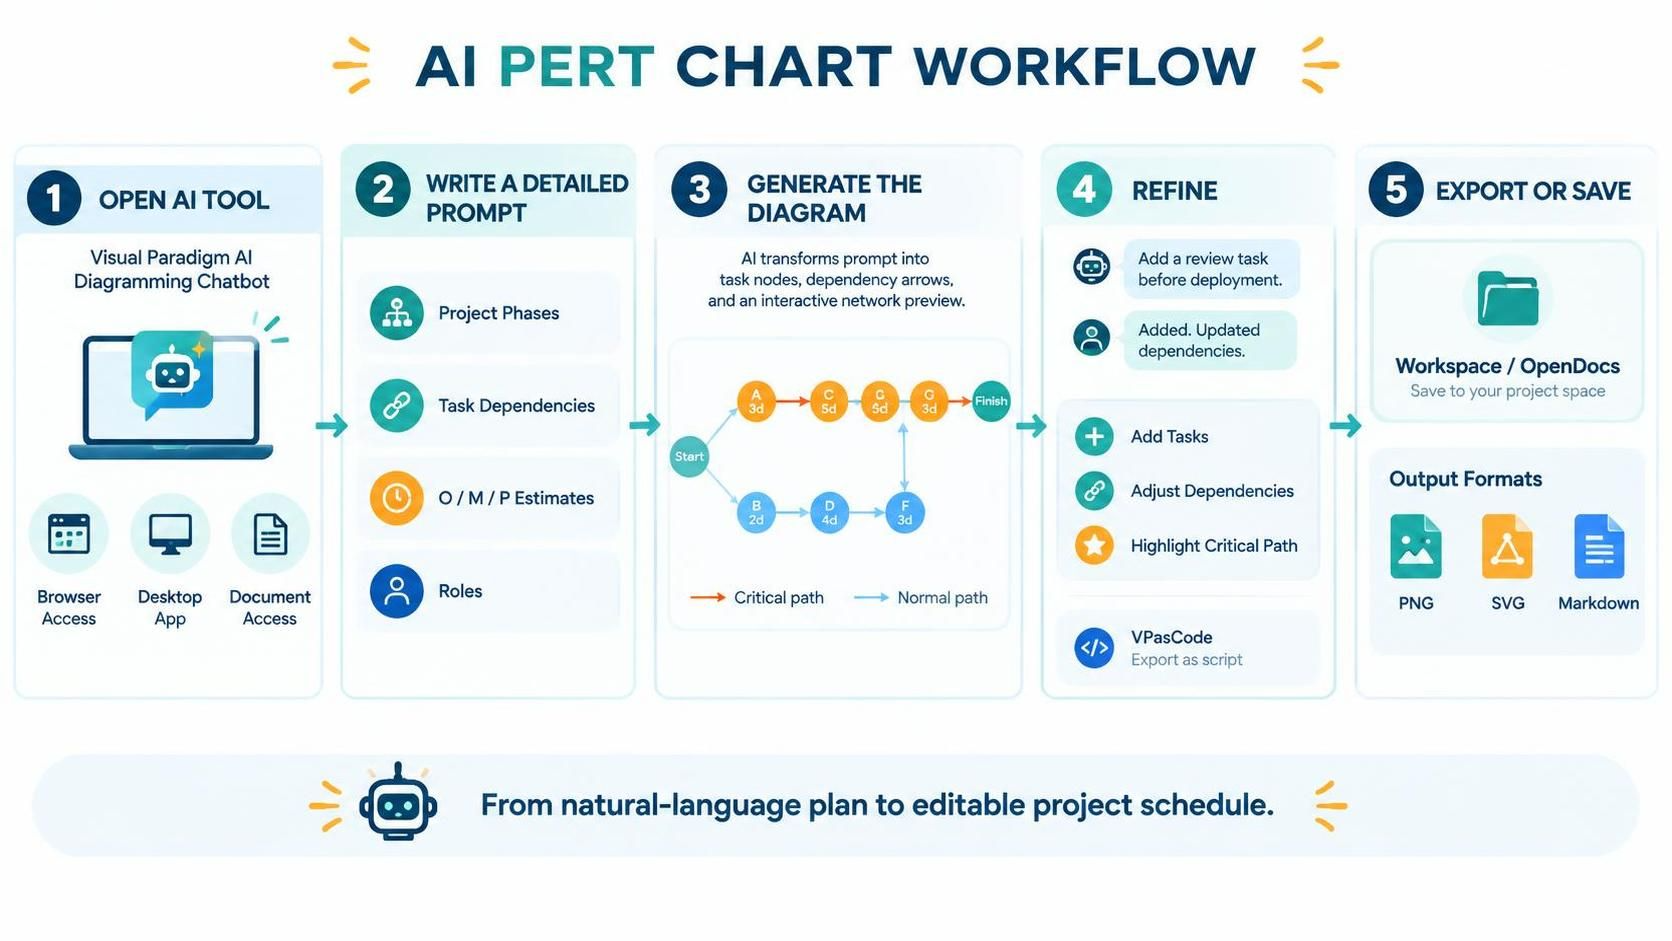
Access the Visual Paradigm AI Diagramming Chatbot. This is available via the web interface, inside Visual Paradigm Online, Desktop editions, or through OpenDocs. The AI serves as your initial architect, translating natural language descriptions into structured diagram data.
2. Write a Detailed Prompt
The quality of the output depends on the specificity of your input. Your prompt should include:
-
Project Phases: High-level stages of the project.
-
Task Dependencies: Which tasks must finish before others begin.
-
Time Estimates: Provide Optimistic (O), Most Likely (M), and Pessimistic (P) values for accurate critical path calculation.
-
Roles: Optionally, specify who is responsible for key tasks to pre-populate RACI data.
3. Generate the Diagram
Submit your prompt. The AI will parse the information, create the nodes, draw dependency arrows, and calculate the timeline structure. You will see an interactive preview of the network diagram.
4. Refine via Chat or Editor
Rarely is the first draft perfect. Use follow-up prompts to adjust dependencies, add missing tasks, or request that the AI highlight the critical path in red. You can also switch to the visual editor to manually tweak layout, labels, and durations, or export the underlying script to VPasCode for version control.
5. Export or Save
Once satisfied, save the diagram to your workspace or OpenDocs for collaborative editing. You can also export the final chart as a PNG, SVG, or Markdown file for inclusion in stakeholder reports.
Diagram Examples using PlantUML
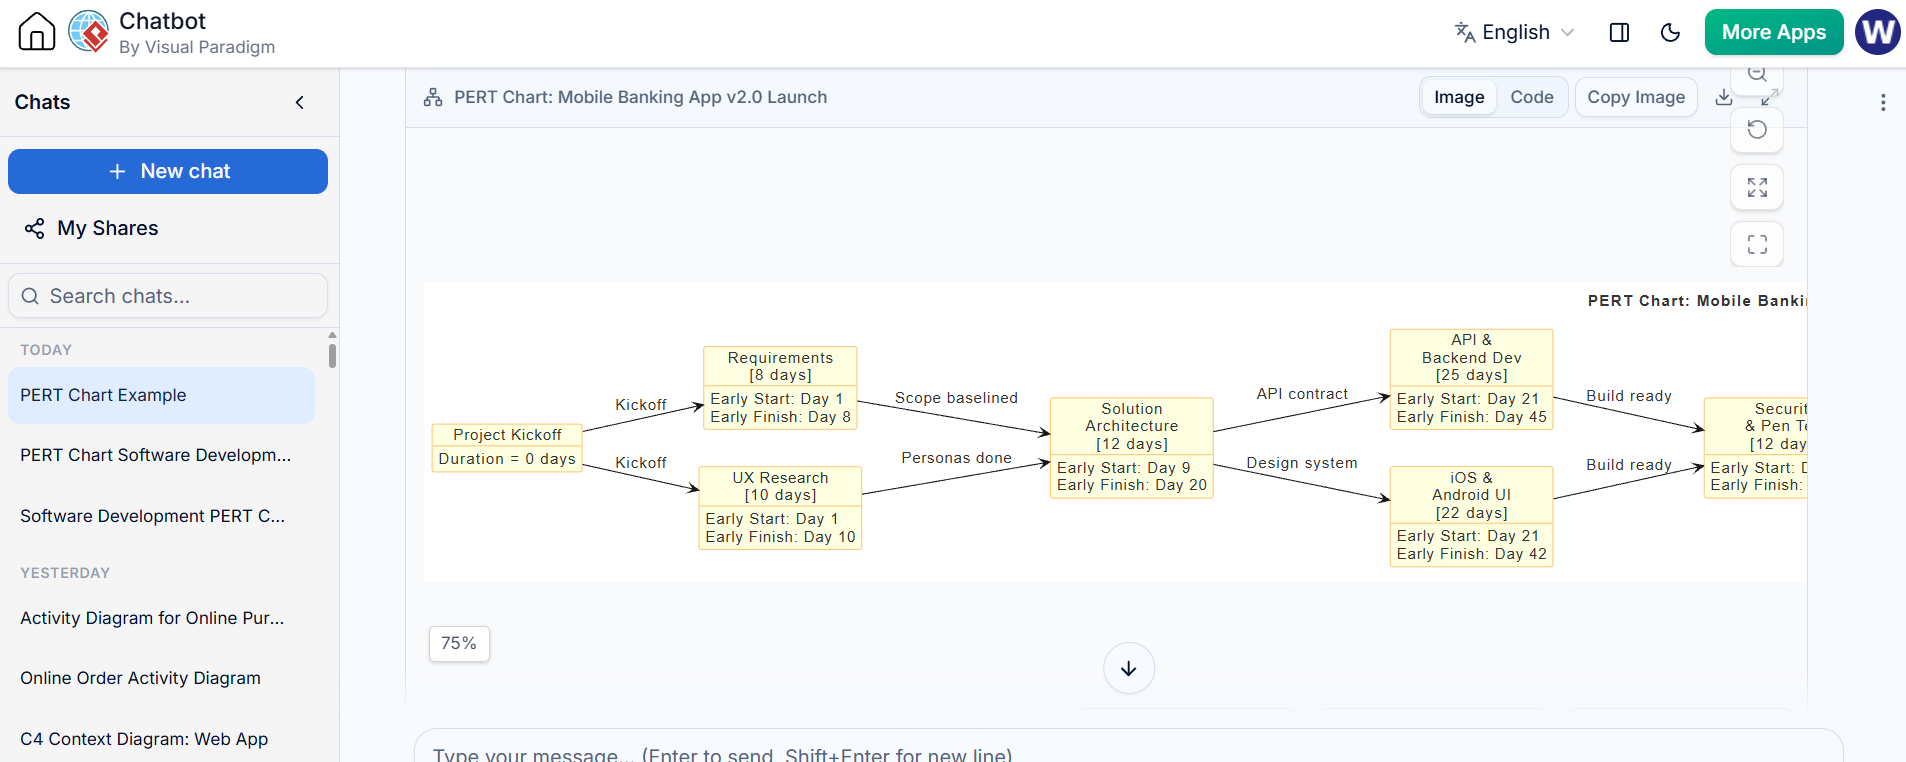
While Visual Paradigm offers a proprietary rich-editor experience, understanding the underlying structure via PlantUML can be helpful for developers and technical project managers who prefer code-based diagramming. Below is an example of how a simple software development PERT chart might be structured in PlantUML, reflecting the O/M/P estimates and dependencies.
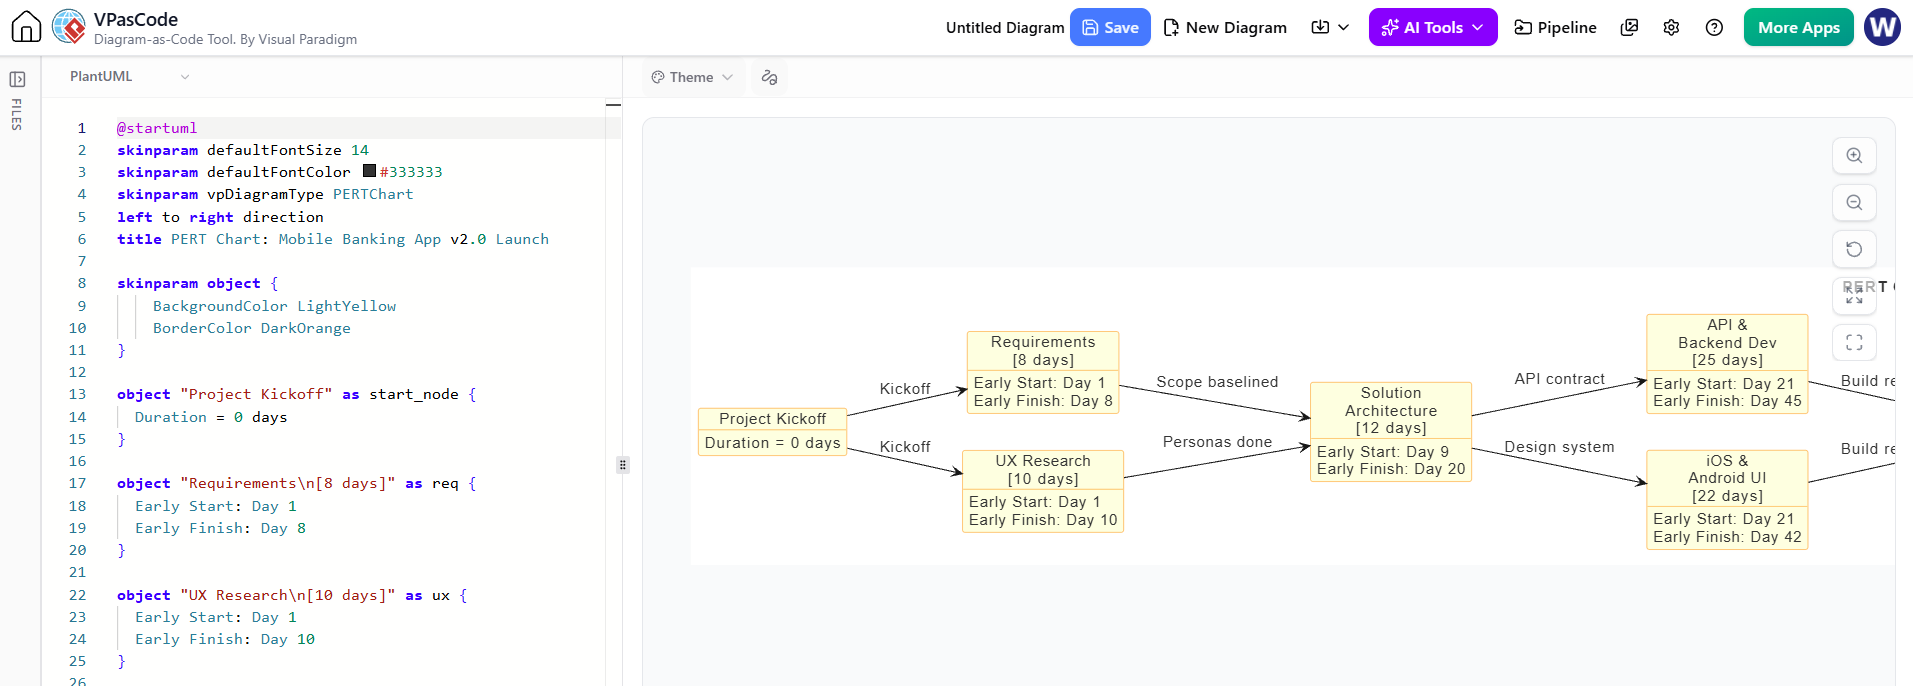
@startuml
skinparam defaultFontSize 14
skinparam defaultFontColor #333333
skinparam vpDiagramType PERTChart
left to right direction
title PERT Chart: Mobile Banking App v2.0 Launch

skinparam object {
    BackgroundColor LightYellow
    BorderColor DarkOrange
}

object "Project Kickoff" as start_node {
  Duration = 0 days
}

object "Requirements\n[8 days]" as req {
  Early Start: Day 1
  Early Finish: Day 8
}

object "UX Research\n[10 days]" as ux {
  Early Start: Day 1
  Early Finish: Day 10
}

object "Solution\nArchitecture\n[12 days]" as arch {
  Early Start: Day 9
  Early Finish: Day 20
}

object "API &\nBackend Dev\n[25 days]" as backend {
  Early Start: Day 21
  Early Finish: Day 45
}

object "iOS &\nAndroid UI\n[22 days]" as mobile {
  Early Start: Day 21
  Early Finish: Day 42
}

object "Security\n& Pen Test\n[12 days]" as security {
  Early Start: Day 46
  Early Finish: Day 57
}

object "Integration\nTesting\n[14 days]" as sit {
  Early Start: Day 58
  Early Finish: Day 71
}

object "UAT &\nSign-off\n[10 days]" as uat {
  Early Start: Day 72
  Early Finish: Day 81
}

object "App Store\nSubmission\n[7 days]" as release {
  Early Start: Day 82
  Early Finish: Day 88
}

object "Project Closure" as end_node {
  Duration = 0 days
}

start_node --> req : "Kickoff"
start_node --> ux : "Kickoff"
req --> arch : "Scope baselined"
ux --> arch : "Personas done"
arch --> backend : "API contract"
arch --> mobile : "Design system"
backend --> security : "Build ready"
mobile --> security : "Build ready"
security --> sit : "No criticals"
sit --> uat : "SIT passed"
uat --> release : "PO approval"
release --> end_node : "Live in stores"

@endumlNote: While PlantUML is excellent for structural representation, Visual Paradigm’s Enhanced PERT Chart provides superior features for RACI assignment, AI generation, and direct task manager synchronization.
Enhanced Features in Action
The true power of Visual Paradigm’s PERT tool lies in its four additional features that integrate with different building blocks of the Visual Paradigm ecosystem.
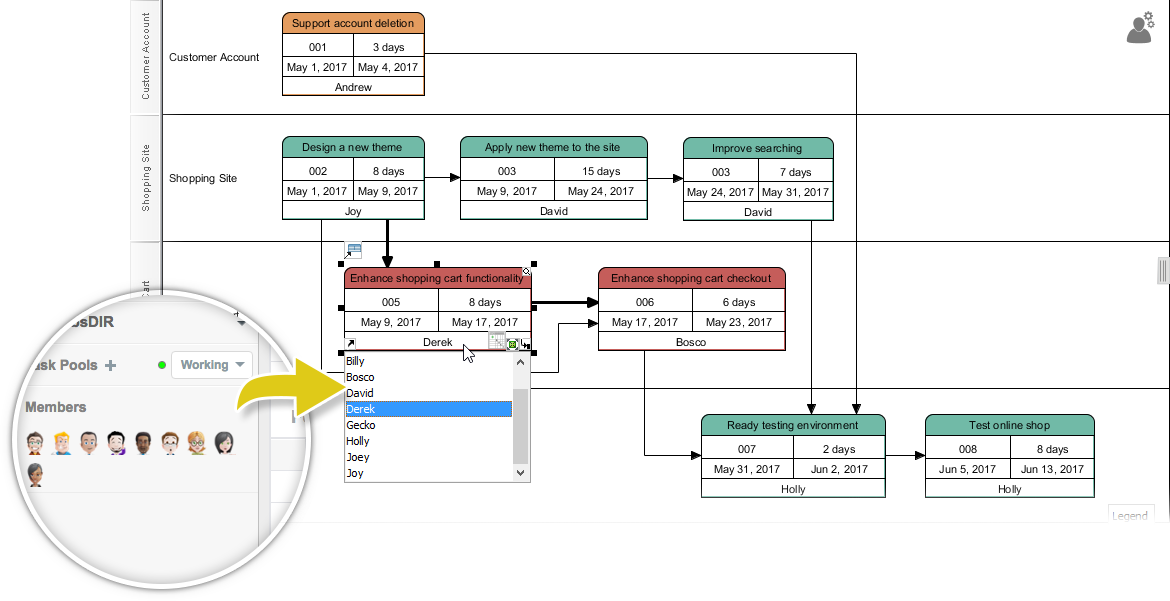
1. Selection of Responsible Person
If you are using team solutions like VP Online or Teamwork Server, you can select specific team members to be the responsible person for each task directly within the PERT Chart. This eliminates the need for separate spreadsheets to track ownership.
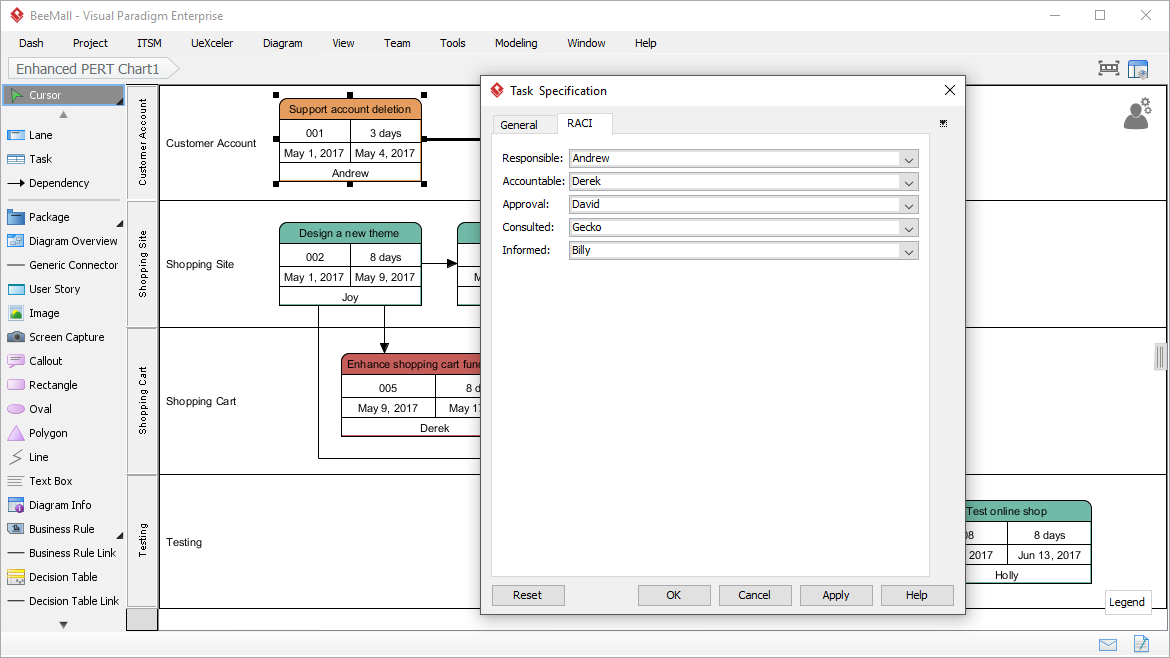
2. Task-Based RACI
Beyond simple responsibility, you can define the full RACI matrix for each task. This detailed role depiction ensures that when the PERT chart is synchronized to the task manager, the workflow respects the organizational hierarchy. For instance, a task may be “Responsible” by a developer, but “Accountable” by a tech lead.
3. Generate Tasks from PERT Chart
Once the schedule baseline is established, you can synchronize the PERT chart to the Task Manager. Tasks are automatically generated and assigned to the corresponding members. This seamless transition from planning to execution reduces administrative overhead and ensures that the plan created in the diagram is exactly what gets executed in the task list.
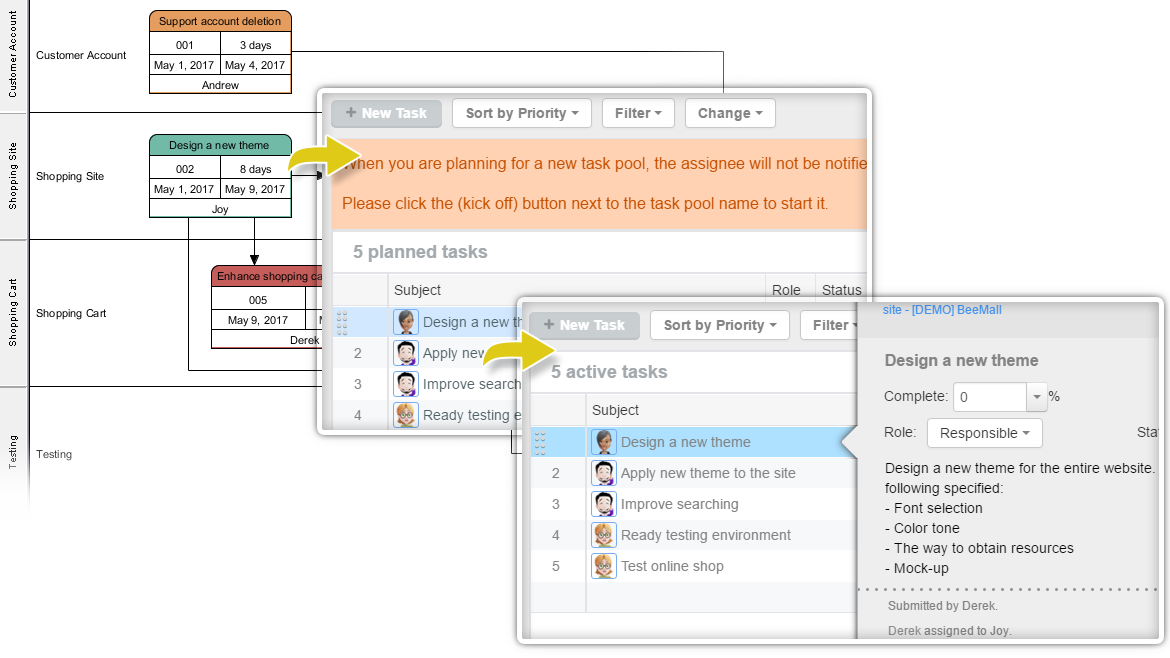
4. Execute PERT Chart in Action
The integration is dynamic. Initially, only the “Responsible” member sees the task. When they mark it as complete, the system automatically flows the task to the next person in the RACI chain (e.g., the “Accountable” person for approval). This creates an automated workflow driven by the project schedule.
Efficiency Meets Planning: AI-Powered PERT Chart Generation
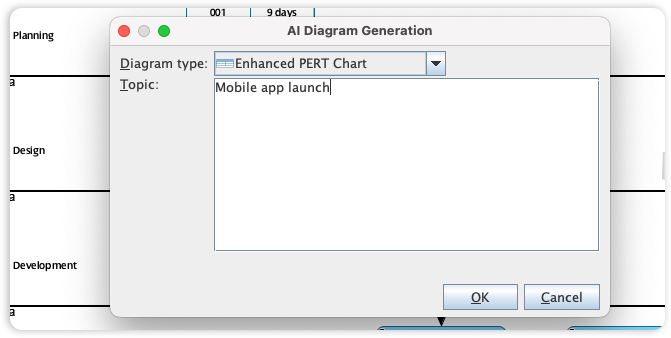
Visual Paradigm’s commitment to efficiency is evident in its integration of full PERT support into the AI Diagram Generator. This feature transforms how you visualize project dependencies and milestones by skipping the manual setup of nodes and time estimates.
By simply describing your project phases and their sequences, the AI automatically calculates and renders a structurally sound network diagram. This allows you to focus on resource allocation and risk management rather than the manual plotting of task flows.
Example Prompts for AI Generation
To get the best results from the AI Diagramming Chatbot, use structured prompts that include specific data points.
With Three-Point Estimates:
“Generate a PERT chart for app development with O, M, and P times for design (3, 5, 8 days), development (5, 10, 20 days), and testing (2, 4, 6 days), showing dependencies and the critical path.”
From a Project Narrative:
“Create a PERT chart for a website redesign project including UX, UI, development, content migration, and QA, and highlight the critical path.”
These prompts enable the AI to not only draw the boxes but also perform the mathematical calculations required for accurate PERT analysis.
Conclusion
The Enhanced PERT Chart tool in Visual Paradigm represents a significant leap forward in project management technology. By combining the analytical rigor of PERT with the collaborative power of RACI matrices and the speed of AI generation, it addresses the common pain points of traditional project planning.
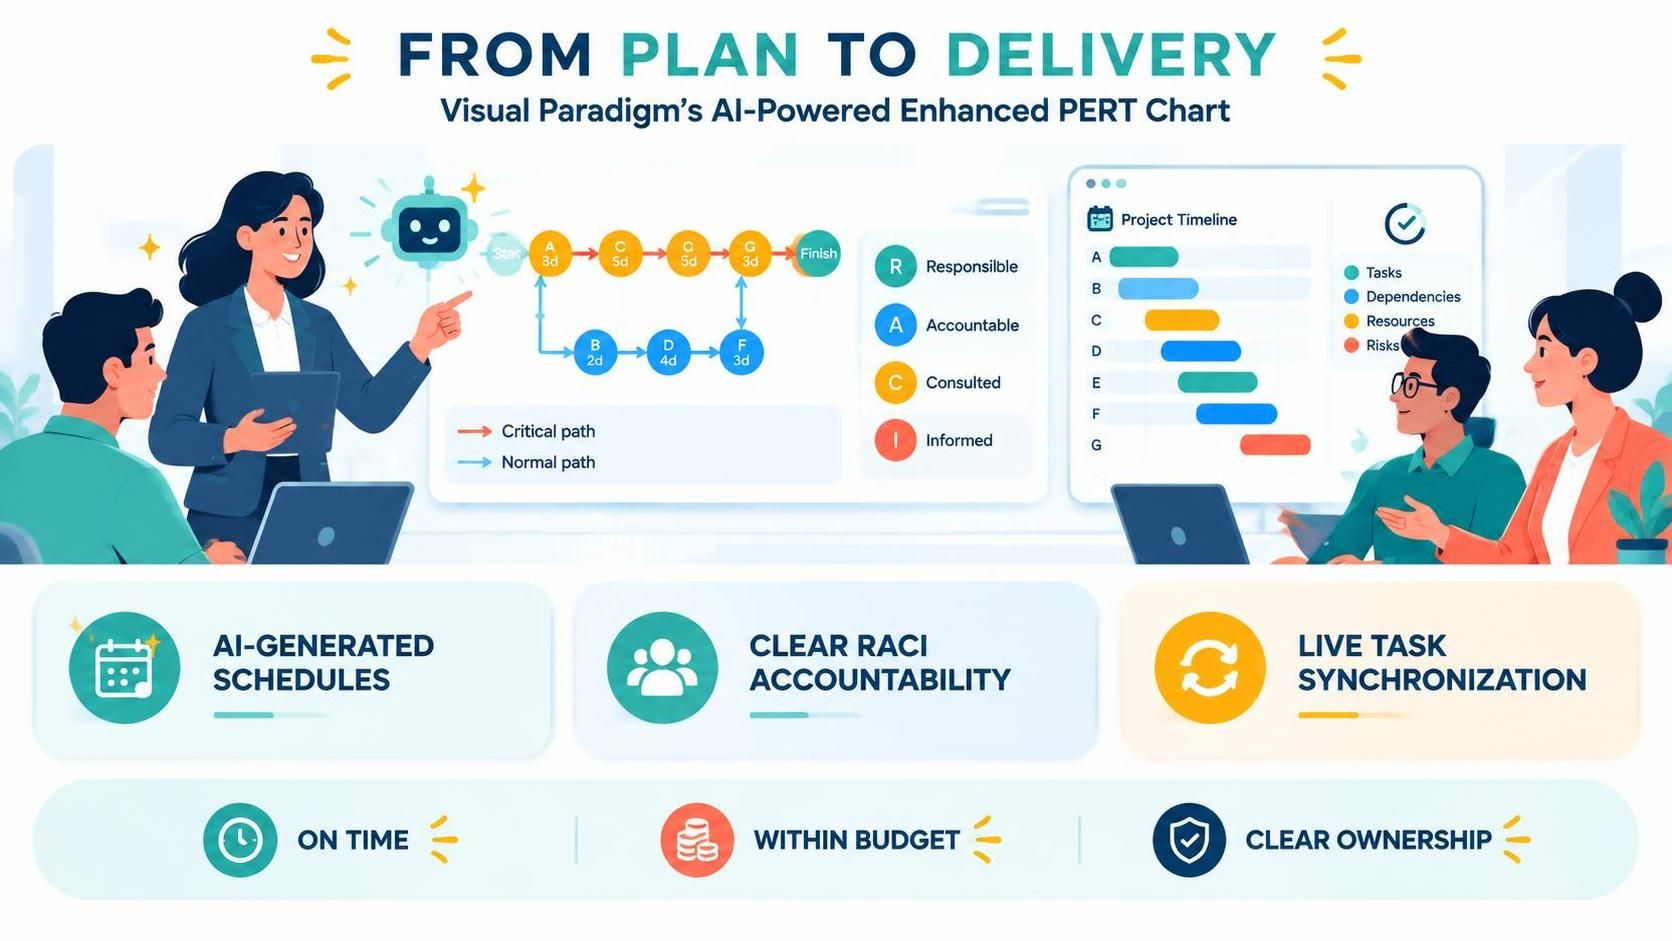
For project managers, the ability to generate diagrams from natural language prompts reduces the barrier to entry for complex scheduling. For teams, the synchronization with Task Manager ensures that plans are not just static documents but active drivers of workflow. Whether you are managing a small software sprint or a large-scale enterprise rollout, leveraging Visual Paradigm’s AI-powered PERT tools can help you deliver projects on time, within budget, and with clear accountability.
Recommended Resources
-
AI Work Breakdown Structure & PERT Chart Generator: Official guide on using Visual Paradigm’s AI tools to generate WBS and PERT charts from text prompts.
-
PERT Chart: A Guide to AI-Powered Project Scheduling: Comprehensive documentation on critical path analysis and AI-driven scheduling techniques.
-
A Complete Guide to Visual Paradigm’s AI-Powered PERT Chart Generator: In-depth tutorial covering best practices for prompting and refining AI-generated PERT charts.
-
Mastering Project Timelines: AI-Powered PERT Charts in OpenDocs: Guide on embedding and managing AI-generated PERT charts within Visual Paradigm OpenDocs for collaborative projects.
-
PERT Chart Tutorial: Step-by-step visual tutorial for creating and customizing PERT charts manually and via AI.
-
A Practical Guide to PERT Charts in PlantUML: Technical guide for developers interested in code-based PERT chart generation using PlantUML syntax.

