


The C4 Model is a powerful, structured approach to software architecture documentation that enables teams to communicate system design clearly and effectively. At its core, the C4 Model uses a hierarchical, zoomable structure—starting from a high-level system context and drilling down into increasingly detailed views. This guide provides a complete, step-by-step walkthrough of how to create a C4 Component Diagram using Visual Paradigm, leveraging both AI-powered generation and manual design, while aligning with the broader C4 diagram levels.

🔷 Understanding the C4 Model Hierarchy
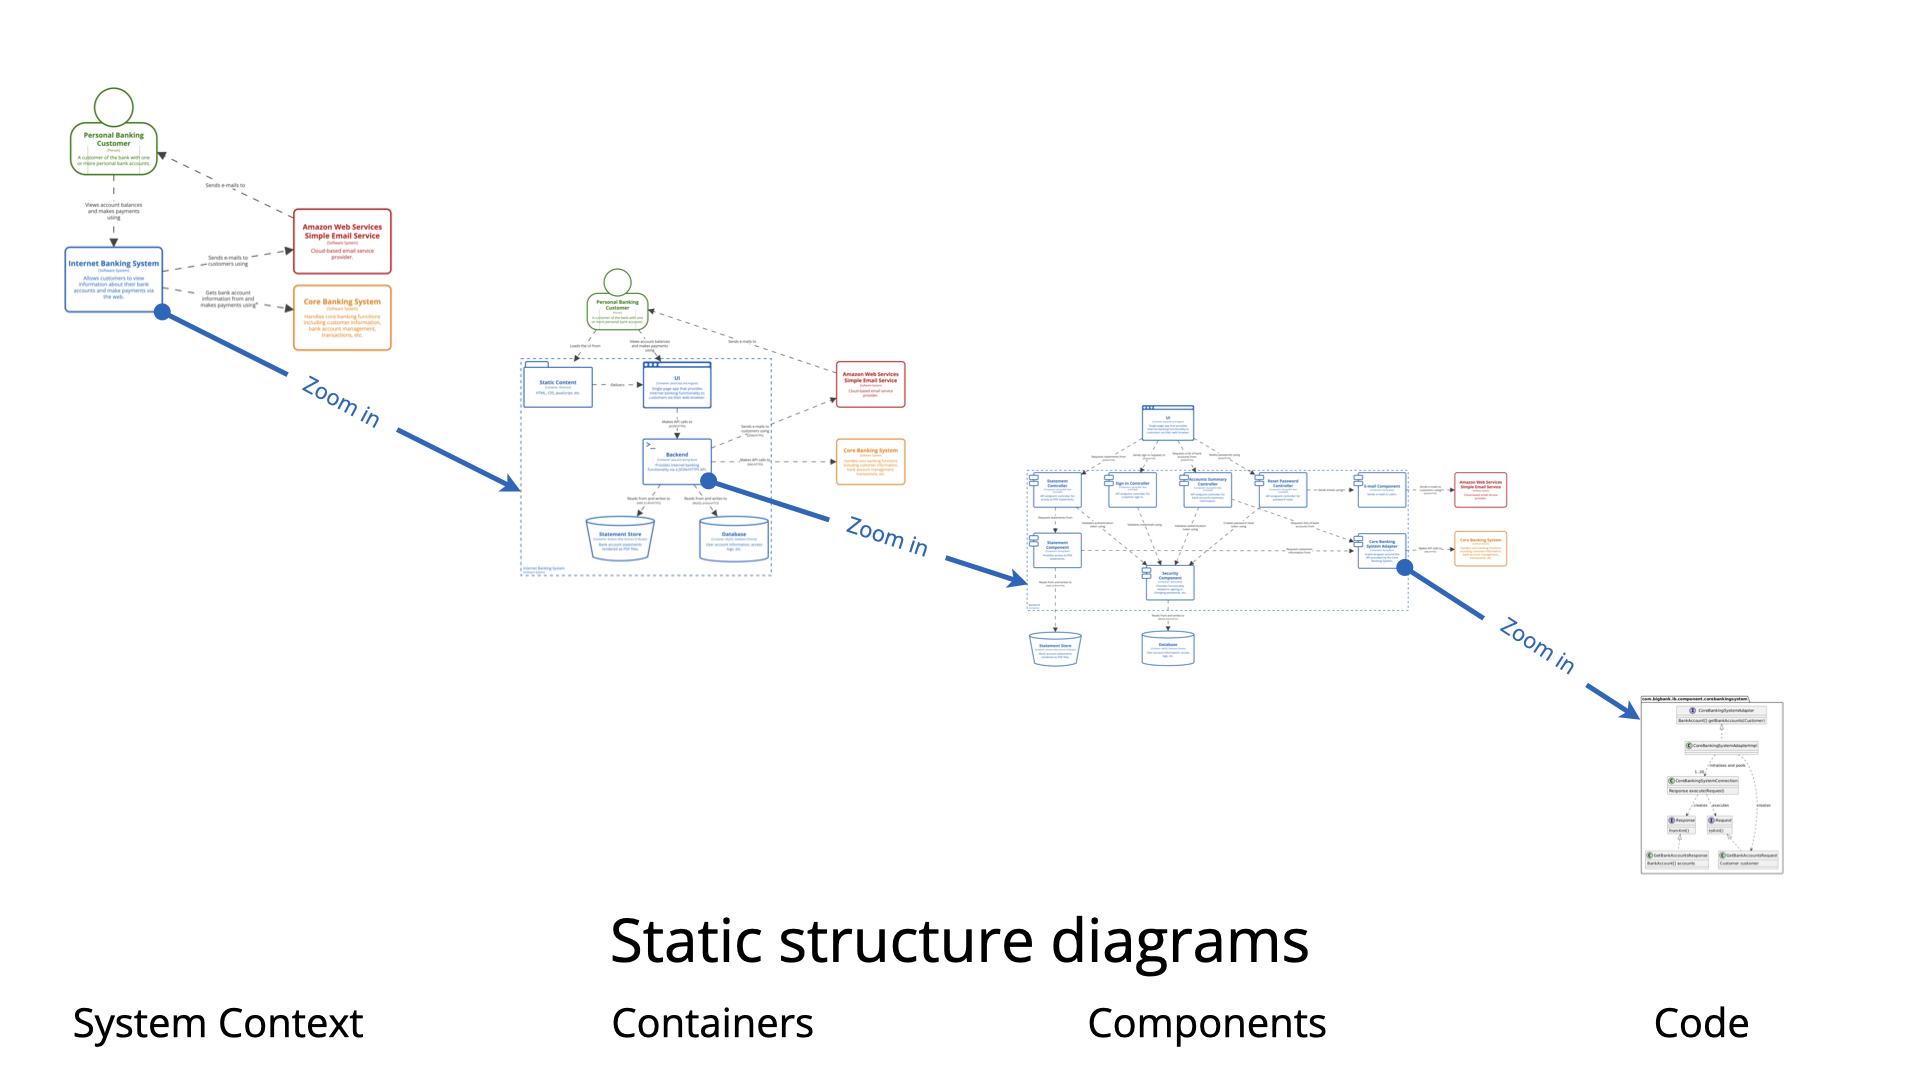
Before diving into component diagrams, it’s essential to understand the four levels of the C4 Model:
| Level | Diagram Type | Purpose |
|---|---|---|
| Level 1 | System Context Diagram | Shows the system and its external users or systems. |
| Level 2 | Container Diagram | Breaks down the system into major containers (e.g., web app, database, mobile app). |
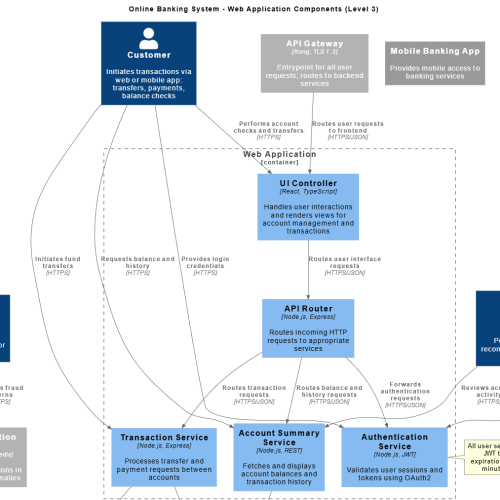
| Level 3 | Component Diagram | Zooms into a single container to show internal components (e.g., services, controllers, DAOs). |
| Level 4 | Code Diagram (Optional) | Provides detailed UML-level code structure (classes, methods, etc.). |
✅ The Component Diagram (Level 3) is where we focus: it reveals the “how” behind a container by detailing its internal structure and interactions.
🛠️ Step-by-Step Guide to Creating a C4 Component Diagram in Visual Paradigm
✅ Step 1: Open Your Project in Visual Paradigm
-
Launch Visual Paradigm Desktop or access Visual Paradigm Online.
-
Open your existing project or create a new one for your system.
💡 Pro Tip: Ensure you have a System Context Diagram and Container Diagram already created—these serve as the foundation for zooming into a container.
✅ Step 2: Use the AI Chatbot (Fastest Method)
Visual Paradigm’s AI Chatbot enables instant diagram generation from natural language prompts.
🔹 How to Use the AI Chatbot:
-
Click on Tools > Chatbot (located in the top menu bar).
-
Enter a prompt such as:
Generate a C4 component diagram for the "User Management Service" container in the "E-Commerce Platform" system. -
The AI will:
-
Automatically generate a component diagram.
-
Suggest relevant components (e.g.,
UserController,UserService,UserRepository,AuthenticationService). -
Add relationships between components (e.g.,
UserController → UserServicevia HTTP call).
-
-
Refine the output:
-
Ask: “Add a JWT Token Validator component.”
-
Ask: “Remove the ‘EmailService’ and rename ‘UserRepository’ to ‘DatabaseUserDAO’.”
-
Ask: “Show the technology stack: Spring Boot, JPA, PostgreSQL.”
-
✅ AI Advantages:
Rapid prototyping.
Natural language input.
Fully editable post-generation.
⚠️ Important Note: AI-generated diagrams are suggestions. Always verify accuracy—especially for complex dependencies or incorrect component naming.
✅ Step 3: Manual Creation Method (For Full Control)
If you prefer a hands-on approach, follow these steps:
-
Go to Diagram > New > C4 > Component Diagram.
-
From the Palette, drag and drop the Component element onto the canvas.
-
Add components representing logical modules:
-
UserController(handles HTTP requests) -
UserService(business logic) -
UserRepository(data access layer) -
AuthenticationService(security logic) -
EmailService(external integration)
-
-
Use Relationships to connect components:
-
Right-click a component → Create Relationship → Choose Dependency or Call.
-
Label relationships clearly (e.g., “Calls”, “Depends on”, “HTTP POST”).
-
-
Add Technology Labels:
-
Right-click a component → Properties → Add Technology (e.g., Spring Boot Controller, Hibernate JPA, PostgreSQL).
-
📌 Example Relationship:
UserController → UserService (HTTP POST /api/users)
UserService → UserRepository (JPA query)
UserService → EmailService (Send welcome email)
✅ Step 4: Refine and Enhance the Diagram
To make your diagram informative and professional:
| Action | How to Do It |
|---|---|
| Rename Components | Double-click to edit labels (e.g., change Component1 to OrderProcessingService). |
| Add Descriptions | Use the Note element to explain responsibilities (e.g., “Handles user registration and validation”). |
| Use Colors & Icons | Apply color coding for types (e.g., blue for services, green for data access). |
| Group Related Components | Use Package elements to group components (e.g., Authentication Package, Data Access Layer). |
| Include External Systems | Add supporting entities like External Payment Gateway or LDAP Server if they interact with components. |
📝 Best Practice: Always label relationships with the type of interaction (e.g., “Calls via REST API”, “Uses JDBC”, “Publishes to Kafka”).
✅ Step 5: Export and Share the Diagram
Once finalized:
-
Save the diagram in your project.
-
Export as:
-
PNG / SVG (for documentation)
-
PDF (for reports or presentations)
-
HTML (for web-based sharing)
-
-
Use Diagram > Export or File > Export.
💡 Pro Tip: Link this diagram to your Container Diagram and System Context Diagram using Hyperlinks in Visual Paradigm for seamless navigation.
🔗 Relationship with Other C4 Diagram Levels
The C4 Component Diagram is not an isolated artifact—it’s part of a cohesive architectural narrative:
| Level | Role in C4 Ecosystem |
|---|---|
| Level 1 (System Context) | The component diagram is contained within one of the containers shown here. For example, “User Management Service” is a container in the system context. |
| Level 2 (Container Diagram) | The component diagram zooms into one container (e.g., a web app, microservice, or database). It explains how that container is structured internally. |
| Level 3 (Component Diagram) | Focuses on internal modularity, component responsibilities, and communication patterns. |
| Level 4 (Code Diagram) | Optional. Can be used to drill down further into a single component (e.g., show classes and methods in a UserService). |
🔄 Navigation Flow:
System Context → Container → Component → (Optional) Code
This hierarchical zooming ensures clarity and scalability across documentation.
🧩 Key Components of a C4 Component Diagram
| Element | Description |
|---|---|
| Components | Modular, self-contained units of functionality (e.g., PaymentService, CacheManager). |
| Supporting Entities | External systems, people, or other containers that interact with components (e.g., Customer, Third-Party API). |
| Relationships | Labeled connections showing how components interact (e.g., Calls, Depends on, Publishes to). |
| Technology Labels | Optional but recommended—specify frameworks, databases, or protocols (e.g., Spring Boot, gRPC, Redis). |
📌 Do not confuse components with classes—components are logical units of the system, not code-level details.
✅ Advantages of Using Visual Paradigm for C4 Component Diagrams
| Feature | Benefit |
|---|---|
| AI-Powered Generation | Create diagrams in seconds using natural language. |
| Fully Editable | AI-generated diagrams can be modified freely—no locked templates. |
| Seamless Integration | Navigate between System Context, Container, and Component diagrams with one click. |
| Visual Clarity | Built-in C4 notation, color schemes, and styling options. |
| Collaboration & Sharing | Export, embed, or share via cloud or PDF. |
| PlantUML Support | Generate code from diagrams or import PlantUML syntax. |
🌐 Bonus: Visual Paradigm supports C4 PlantUML Studio, enabling you to write C4 diagrams in code and visualize them instantly.
📌 Best Practices for Effective C4 Component Diagrams
-
Focus on One Container: Only zoom into one container at a time.
-
Use Clear, Descriptive Names: Avoid generic names like
ComponentA. -
Limit Complexity: Keep diagrams readable—use packages to group related components.
-
Document Assumptions: Use notes to explain design decisions (e.g., “Uses caching to reduce DB load”).
-
Review with Team: Ensure alignment with developers and architects.
-
Update Regularly: Treat diagrams as living documents—update when architecture changes.
📚 Reference List (Markdown Format)
- Comprehensive Tutorial: Generating and Modifying C4 Component Diagrams with Visual Paradigm AI Chatbot: A detailed walkthrough of using AI to generate and refine C4 component diagrams in Visual Paradigm.
- Beginner’s Guide to C4 Model Diagrams: An accessible introduction to the C4 Model, covering all four levels and practical tips for beginners.
- Introduction to C4 Model: A Quick Guide: A concise overview of the C4 Model’s philosophy, structure, and benefits in software architecture communication.
- C4 Component Diagram: A Definitive Guide to Your Code’s Internal Structure with AI: A comprehensive guide on creating and leveraging AI-generated component diagrams in Visual Paradigm.
- Visual Paradigm C4 System Context Diagram Tutorial: Step-by-step instructions for building system context diagrams, the foundation for all C4 diagrams.
- Visual Paradigm C4 Container Diagram Tutorial: Detailed guide on creating container diagrams, essential for identifying the target container for component-level zooming.
- Drawing Component Diagrams in Visual Paradigm: Official user guide with technical instructions for manually creating component diagrams.
- Visual Paradigm C4 Diagram Tool Features: Overview of Visual Paradigm’s full suite of C4 diagram tools, including AI, collaboration, and export options.
- Visual Paradigm C4 PlantUML Studio: Integration with PlantUML for writing C4 diagrams in code and generating visual diagrams.
- Visual Paradigm C4 Model Documentation: Official documentation for component diagrams, including best practices and use cases.
✅ Final Thoughts
Creating a C4 Component Diagram in Visual Paradigm is a powerful way to document the internal structure of a system container. Whether you use the AI Chatbot for speed or manual design for precision, the result is a clear, communicative, and maintainable view of your software architecture.
By following this guide, you’ll ensure your diagrams:
-
Align with the C4 Model’s hierarchical structure.
-
Communicate design decisions effectively.
-
Serve as living documentation for developers, stakeholders, and future architects.
🎯 Remember: The goal of C4 is not just to draw diagrams—it’s to enable shared understanding across teams.
📌 Ready to get started?
Open Visual Paradigm → Use the AI Chatbot → Prompt:
“Generate a C4 component diagram for the ‘Order Processing Service’ container in a cloud-based e-commerce system.”
Let the AI do the heavy lifting—then refine, validate, and share your architecture with confidence.
