
Introduction: Why I Decided to Test Visual Paradigm’s Deployment Tools
As a solutions architect who has spent years wrestling with infrastructure documentation, I’ve tried countless tools for mapping deployment topologies. From whiteboard sketches to complex DSL-based generators, each approach has trade-offs between speed, precision, and maintainability. When I heard about Visual Paradigm’s dual approach—traditional manual modeling paired with AI-powered generation—I was skeptical but intrigued. Could an AI really understand my infrastructure requirements and produce a standards-compliant UML diagram? And if so, would the traditional tools still hold value for complex, fine-tuned architectures?
Over the past few weeks, I put both workflows through their paces: modeling a multi-tier cloud application manually, then asking the AI chatbot to generate the same architecture from a plain-English description. This guide shares my firsthand experience, practical tips, and honest assessment of when to use each method. Whether you’re a DevOps engineer, system administrator, or product architect, you’ll find actionable insights to streamline your infrastructure documentation.

What is a UML Deployment Diagram?
Before diving into the tools, let’s clarify the foundation. A Deployment Diagram is a static UML diagram that shows the physical configuration of hardware and software components in a system. It models the runtime allocation of software artifacts to physical or virtual nodes.
Core Components I Worked With
-
Node: A computational resource, represented as a 3D box. During my testing, I used nodes for physical devices (servers, mobile phones) and software execution environments (VMs, Docker containers, application servers). Nodes can be nested—a feature I leveraged heavily for containerized architectures.
-
Artifact: A physical piece of software, such as an executable file (
.exe), a library (.jar), a web archive (.war), or a database schema. Artifacts are the deployable units of your software and are typically shown inside the node where they are deployed. -
Communication Path: A solid line connecting two nodes, representing a communication link between them. I appreciated being able to stereotype these with protocols like
<<http>>or<<jdbc>>for clarity. -
Deployment Relationship: A dashed arrow with the
<<deploy>>stereotype, pointing from an artifact to the node it is deployed on.
The diagram provides an unambiguous map of where your software components will live and how they will interact at a physical level—a critical asset during architecture reviews or incident post-mortems.
Why Use AI for Deployment Diagrams? My Take
Documenting infrastructure is essential but often neglected because it’s tedious to create and keep up-to-date. After testing Visual Paradigm’s AI features, I can confidently say they address this pain point effectively.
-
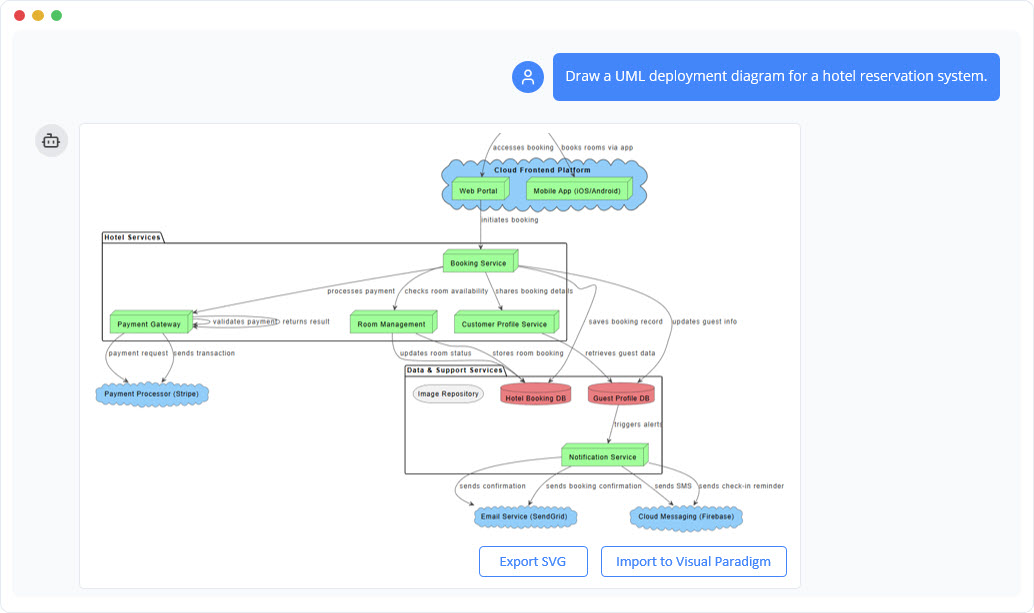
From Description to Topology in Seconds: I described a three-tier cloud architecture in natural language (“A web application with a load balancer, two application servers behind an auto-scaling group, and a replicated PostgreSQL database”), and the AI generated a complete, correctly notated deployment diagram in under 30 seconds. This saved me hours of manual dragging and connecting.
-
Master Complex, Multi-Tiered Architectures: When I asked the AI to model nested environments (Docker containers on VMs on physical servers), it produced a clear, layered diagram that would have taken significant effort to assemble manually. The AI handled the visual hierarchy intuitively.
-
Dynamic Scenario Planning: One of my favorite use cases: rapidly comparing deployment strategies. I prompted the AI with “Show me the same architecture but with a redundant database node in a different availability zone,” and it updated the diagram instantly. This is invaluable for cost/performance trade-off discussions.
-
Ensure Clarity and Standardization: As someone who has reviewed dozens of inconsistent architecture diagrams, I appreciated that the AI acted as a UML expert, ensuring correct symbols and notations every time. The output was professional and universally understandable.
Traditional Methods: My Experience with Manual Modeling
For complex systems requiring granular control, Visual Paradigm’s traditional tools remain powerful. Here’s how I used them:
-
Standard Manual Creation: In the desktop app, I navigated to Diagram > New > Deployment Diagram. Dragging nodes, components, and artifacts from the palette felt intuitive, and the snap-to-grid alignment kept my diagram clean.
-
Template-Based Design: Visual Paradigm Online offered pre-designed templates with placeholders. Double-clicking nodes to change properties (like IP addresses or deployment paths) was straightforward and saved setup time.
-
Resource Catalog: This feature significantly sped up my workflow. By dragging the resource icon from an existing node, I could instantly create and link a new associated node or artifact—perfect for scaling out server clusters.
-
PlantUML Builder: As someone comfortable with code, I loved the PlantUML integration. Defining architecture using text-based scripts allowed for version control and easy collaboration with engineering teams. [4, 7, 8, 9, 10, 11]
When I Recommend Traditional Methods: Use manual modeling when you need pixel-perfect control, are working with highly customized or legacy infrastructure, or when collaborating with stakeholders who prefer iterative, visual refinement.
AI-Powered Methods: Testing the Chatbot and Text-to-Diagram Features
This is where Visual Paradigm truly impressed me. The AI tools automate initial layout and enable conversational refinement—a game-changer for rapid prototyping.
-
AI Chatbot Generator: I described my system infrastructure to the Visual Paradigm AI Chatbot: “A web application with a load balancer and three server nodes.” It instantly generated a standards-compliant UML diagram that I imported into the desktop app for further editing. The accuracy was remarkable.
-
Text-to-Diagram Tool: Accessible via Tools > AI Diagram, this feature let me paste unstructured notes from a meeting. The AI interpreted my intent, identified hardware nodes, and modeled communication protocols automatically—no diagramming expertise required.
-
Conversational Editing: After generation, I used the chatbot like a team member. Commands like “Add a redundant database node” or “Remove the user actor” updated the diagram instantly. This iterative, conversational workflow felt natural and efficient.
-
OpenDocs Integration: The AI generator is also integrated into OpenDocs, allowing me to generate deployment architecture directly within my documentation workflow. This eliminated context-switching and kept diagrams synchronized with written specs. [1, 2, 13, 14, 15, 16, 17]
When I Recommend AI Methods: Use AI-powered generation for rapid prototyping, brainstorming sessions, initial architecture drafts, or when you need to quickly explore multiple deployment scenarios.
Common Use Cases: Real-World Applications I Explored
Deployment diagrams are essential for a variety of IT and software development activities. Here’s how I applied them:
-
Infrastructure Planning: I used the diagram as the official blueprint for provisioning a new staging environment. Sharing the visual with our cloud team reduced misconfiguration risks.
-
DevOps and Infrastructure as Code (IaC): The deployment diagram served as the visual specification for our Terraform scripts. Having a shared visual reference ensured the entire team was aligned on the target state.
-
Security and Network Reviews: The diagram provided a clear visual of all nodes and communication paths, making it easy for our security engineers to review firewall rules and identify potential vulnerabilities.
-
Performance and Bottleneck Analysis: Visually tracing dependencies and communication links helped me identify a potential latency bottleneck between our application tier and database—something we addressed before deployment.
How to Generate Deployment Diagrams with AI: Example Prompts That Worked for Me
Clear and structured prompts yield the best results. Here are the prompts I tested successfully:
-
Basic Nodes: “Create a deployment diagram with two nodes: a ‘Client Machine’ and a ‘Server’.”
-
Deploying Artifacts: “Deploy an artifact named ‘app.exe’ onto the ‘Client Machine’ node.”
-
Adding Connections: “Draw an HTTPS communication path from the ‘Client Machine’ to the ‘Server’.”
-
Nesting Environments: “Nest an ‘Execution Environment’ node called ‘Docker Container’ inside the ‘Server’ node. Move the ‘app.war’ artifact into the ‘Docker Container’.”
-
Complex Topologies: “Create a three-tier architecture: a ‘Web Tier’ with a ‘Web Server’, an ‘App Tier’ with an ‘Application Server’, and a ‘Data Tier’ with a ‘Database Server’.”
Pro Tip: Be specific about protocols, replication factors, and availability zones when describing production systems. The AI handles these details well when explicitly mentioned.
A Modern Workflow for Infrastructure Design: Lessons Learned
Embedding AI-powered deployment modeling into core operational practices transformed how our team works. Here’s the workflow I now recommend:
-
Design Before Provisioning: No new environment should be built without an accompanying AI-generated target deployment diagram. This visual-first approach catches design flaws early.
-
Visual Spec for IaC: The deployment diagram is the first artifact created before writing any infrastructure code. This ensures alignment between architects and engineers.
-
Visual Change Management: Before changing infrastructure, model the change in the deployment diagram. The visual impact analysis should be part of the change approval process.
-
Living Operational Documentation: Because AI makes updates so easy, the deployment diagram can become the canonical, living documentation of your system’s runtime environment—no more outdated Visio files gathering dust.
Conclusion: My Final Verdict on Visual Paradigm’s Deployment Tools
After extensive hands-on testing, I’m convinced that Visual Paradigm’s dual approach to deployment diagrams offers exceptional value. The traditional manual tools provide the granular control needed for complex, production-grade architectures, while the AI-powered features dramatically accelerate prototyping, scenario planning, and documentation maintenance.
What impressed me most was the seamless integration between the two workflows: I could start with an AI-generated draft, refine it conversationally, then switch to manual editing for fine-tuning—all within the same platform. For teams balancing speed and precision, this flexibility is invaluable.
If you’re evaluating infrastructure modeling tools, I recommend starting with Visual Paradigm’s AI chatbot for rapid exploration, then leveraging the traditional toolkit for final polish. The time saved on diagram creation translates directly to more time for architecture innovation and system reliability.
One caveat: AI-generated diagrams should always be reviewed by a human architect for domain-specific nuances. But as a starting point, collaborator, and documentation aid, Visual Paradigm’s AI tools are among the most practical I’ve tested.
Ready to try it? Ask yourself:
-
Do you have a specific system architecture in mind (e.g., cloud-based, client-server)?
-
Do you prefer using the desktop software or the online web version?
-
Are you looking for a quick draft or a highly detailed production model?
With clear answers to these questions, Visual Paradigm can tailor the experience to your workflow—and based on my testing, you’ll likely be impressed by the results.
References
- AI Deployment Diagram Generator Now Available in OpenDocs: Release notes announcing the integration of AI-powered deployment diagram generation into Visual Paradigm’s OpenDocs documentation platform.
- What is a Deployment Diagram? – UML Guide: Comprehensive guide explaining the fundamentals of UML Deployment Diagrams, their purpose, and core components.
- Beginner’s Guide to Deployment Diagrams with Visual Paradigm Online: Step-by-step tutorial for creating deployment diagrams using Visual Paradigm’s online platform, ideal for newcomers.
- Comprehensive Tutorial on Deployment Diagrams with Visual Paradigm: Detailed walkthrough covering nodes, artifacts, and best practices for modeling infrastructure with Visual Paradigm.
- Drawing Deployment Diagrams – User Guide: Official documentation on manually creating deployment diagrams in Visual Paradigm desktop, including palette usage and property configuration.
- How to Draw a Deployment Diagram in UML: Practical tutorial demonstrating the process of building UML deployment diagrams from scratch.
- PlantUML Deployment Diagram Builder: Feature page describing the text-based PlantUML integration for code-first deployment diagram creation.
- Guide to AI-Powered UML Diagram Generation: Documentation for using Visual Paradigm’s AI chatbot to generate UML diagrams from natural language descriptions.
- AI Chatbot Feature Overview: Product page detailing the capabilities of Visual Paradigm’s AI assistant for diagram creation and refinement.
- Visual Paradigm AI Diagram Generator Demo: Video demonstration showing how to use AI tools to create deployment diagrams quickly.
- AI Diagram Generator Release Announcement: Official release notes introducing the AI-powered diagram generation features across Visual Paradigm products.