


Unified Modeling Language, commonly known as UML, serves as the standard blueprint for software architecture. Whether you are designing a complex enterprise system or a simple web application, understanding these diagrams is essential for clear communication among developers, stakeholders, and designers. For students and junior engineers, the ability to interpret these visual representations can significantly reduce development errors and streamline the design process.
This guide breaks down the mechanics of UML notation, focusing on practical reading skills rather than abstract theory. You will learn to identify key components, understand relationships between elements, and interpret the flow of logic within a system. By the end of this article, you will have a solid foundation for analyzing any standard UML diagram you encounter in documentation or during code reviews.
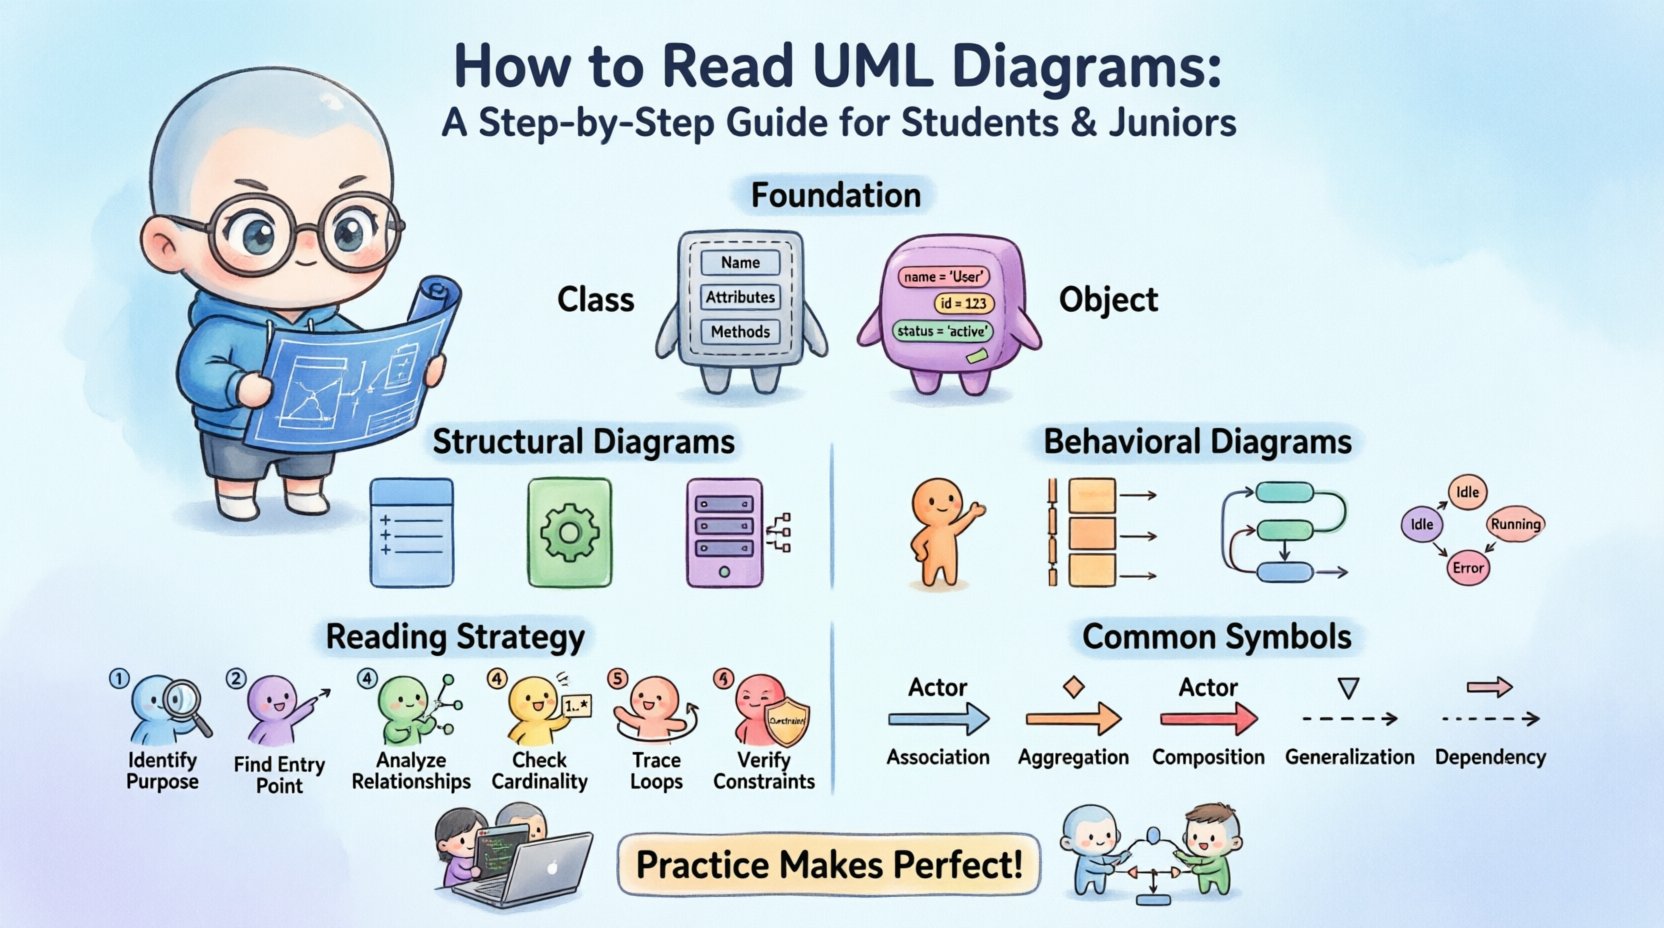
Understanding the Foundation: Classes and Objects 🧱
Before diving into specific diagram types, it is crucial to grasp the fundamental building blocks. Most UML diagrams rely on the concept of a Class and an Object. Confusing these two is a common mistake for beginners.
- Class: This is a blueprint or template. It defines the structure, attributes (data), and behaviors (methods) that objects of that type will possess. It is abstract and exists in the design phase.
- Object: This is an actual instance of a class. It exists in memory at runtime and holds specific values for the attributes defined by the class.
When you see a box with a thick horizontal line separating the top, middle, and bottom sections, you are likely looking at a Class. The top section contains the class name, the middle lists attributes, and the bottom lists methods. Recognizing this structure allows you to quickly parse information about the system’s data model.
The Two Main Categories of UML Diagrams 🗂️
UML diagrams are generally divided into two broad categories: Structure and Behavior. Knowing which category a diagram belongs to helps you determine what aspect of the system you are viewing.
1. Structural Diagrams 🔨
Structural diagrams show the static aspect of a system. They depict the physical or logical components that make up the software and how they relate to one another. Think of these as the architectural blueprints of a house; they show the rooms, walls, and foundation, but not how people move through the house.
- Class Diagram: The most common diagram. It shows classes, attributes, methods, and relationships.
- Object Diagram: A snapshot of the system at a specific point in time, showing instances of classes.
- Component Diagram: Represents the organization of high-level software components.
- Deployment Diagram: Illustrates the physical hardware nodes and how software is deployed across them.
2. Behavioral Diagrams 🔄
Behavioral diagrams describe the dynamic aspects of a system. They focus on how the system acts over time, how data flows, and how objects interact during execution. These are similar to the script of a movie; they show the action and dialogue, but not the set design.
- Use Case Diagram: Shows the interactions between users (actors) and the system functionality.
- Sequence Diagram: Details the order of interactions between objects over time.
- Activity Diagram: Similar to a flowchart, showing the flow of control from activity to activity.
- State Machine Diagram: Describes the different states an object can be in and the transitions between them.
Deep Dive: Structural Diagrams 🔨
Class Diagrams
The Class Diagram is the backbone of object-oriented design. When reading one, focus on the following elements:
- Visibility Modifiers: Symbols before the attribute or method name indicate access levels.
- +: Public (accessible from anywhere).
- –: Private (accessible only within the class).
- #: Protected (accessible within the class and subclasses).
- ~: Package-private (accessible within the same package).
- Static Members: An underscore (_) before the name indicates a static member, which belongs to the class rather than an instance.
- Cardinality: Numbers or asterisks near relationship lines indicate how many instances can be connected. For example,
1means one,0..1means zero or one, and*means many.
Object Diagrams
An Object Diagram is essentially a snapshot of a Class Diagram. It shows specific objects with their current state values. When reading this, look for the double underline under the class name in the object label (e.g., Account: #12345). This distinguishes it from the class definition. These diagrams are useful for debugging or understanding the runtime state of complex interactions.
Component Diagrams
Component diagrams are higher-level than class diagrams. They group classes into modules or libraries. A component is represented by a rectangle with two smaller rectangles on the left side. When reading these, look for the interfaces provided (lollipop shape) and required (socket shape) to understand dependencies between modules.
Deep Dive: Behavioral Diagrams 🔄
Use Case Diagrams
Use Case diagrams focus on the user’s perspective. They answer the question: “What can the system do?”
- Actors: Stick figures representing users or external systems interacting with the software.
- Use Cases: Ovals representing specific functionalities (e.g., “Login”, “Generate Report”).
- Relationships: Lines connecting actors to use cases. Additional relationships include
include(mandatory behavior) andextend(optional behavior).
Sequence Diagrams
Sequence diagrams are critical for understanding logic flow. They are time-based, reading from top to bottom.
- Lifelines: Vertical dashed lines representing objects or participants. The top of the line is the object, and the bottom indicates the passage of time.
- Activation Bars: Thin rectangles on the lifeline indicating when an object is performing an action. This helps visualize parallel processing.
- Messages: Horizontal arrows between lifelines. A solid arrowhead means a synchronous message (wait for response). A dashed arrowhead means an asynchronous message (fire and forget). A solid line with an open arrowhead usually indicates a return message.
- Frames: Rectangles around a group of messages labeled with keywords like
alt(alternative),opt(optional), orloop(repetition).
Activity Diagrams
Activity diagrams function like flowcharts. They show the workflow from start to finish.
- Start Node: A solid black circle.
- End Node: A black circle inside a larger black ring.
- Decision Nodes: Diamonds used for branching logic (if/else statements).
- Swimlanes: Horizontal or vertical bands that organize activities by responsibility (e.g., “User”, “Server”, “Database”).
State Machine Diagrams
These diagrams are ideal for objects with complex life cycles, like an Order or a User Session.
- States: Rounded rectangles showing conditions where an object satisfies an invariant (e.g., “Pending”, “Shipped”, “Delivered”).
- Transitions: Arrows moving from one state to another, triggered by events.
- Events: Triggers that cause a state change (e.g., “Payment Received”).
Common Symbols and Relationships Table 🚦
Memorizing the symbols is the fastest way to improve your reading speed. Refer to this table for quick reference during your analysis.
| Symbol | Relationship Type | Meaning |
|---|---|---|
| ──────────▶ | Association | A structural relationship between objects. Can be bidirectional. |
| ──────────◇ | Aggregation | A whole-part relationship where the part can exist independently of the whole (e.g., A Department has Employees). |
| ──────────◆ | Composition | A strong whole-part relationship where the part cannot exist without the whole (e.g., A House has Rooms). |
| ──────────△ | Generalization | Represents inheritance. The triangle points to the parent class. |
| ────────┄┄▶ | Dependency | A dashed line indicating that one element uses or depends on another. Changes in the dependency may affect the dependent element. |
| ─┄┄┄▶ | Realization | Dashed line with a hollow triangle. Indicates an interface is being implemented. |
A Strategy for Reading Complex Diagrams 🧠
When faced with a large, intricate diagram, staring at the whole picture can be overwhelming. Use this systematic approach to break it down:
- Identify the Purpose: Check the title. Is this a sequence diagram or a class diagram? This sets your context immediately.
- Locate the Entry Point: In sequence diagrams, find the initial actor. In activity diagrams, find the start node. Trace the path from there.
- Analyze Relationships First: Look at the lines connecting boxes. Understand who talks to whom before looking at the specific data being passed.
- Check Cardinality: If reading a class diagram, note the numbers near the lines. This tells you if a one-to-many relationship exists.
- Trace the Loop: If you see a loop frame or a recursive arrow, understand the termination condition. This prevents infinite logic errors in your mental model.
- Verify Constraints: Look for curly brackets
{}containing notes or constraints. These often contain critical business rules.
Common Pitfalls to Avoid ⚠️
Even experienced engineers can misinterpret diagrams if they rush. Here are common errors to watch out for:
- Ignoring Cardinality: Assuming a one-to-one relationship when the diagram shows one-to-many. This leads to incorrect database schema designs.
- Confusing Aggregation and Composition: Treating a weak relationship as a strong one. Composition implies ownership; aggregation implies reference.
- Overlooking Visibility: Assuming all methods are public. In private classes, internal logic is hidden, which affects how you integrate with the system.
- Misinterpreting Arrows: Confusing a dependency arrow with a generalization arrow. The triangle head is distinct from the open arrowhead.
- Neglecting the Legend: Some diagrams use custom notation. Always check the legend or notes section for non-standard symbols.
Practical Application in Projects 💡
Knowing how to read UML is one thing; knowing when to create them is another. In a professional setting, diagrams serve as a contract between the design phase and the coding phase.
- During Design Reviews: Use class diagrams to verify that the object model matches the business requirements. Check if all necessary attributes are present.
- During Onboarding: New team members can use sequence diagrams to understand how the API calls flow without reading thousands of lines of code.
- During Refactoring: State machine diagrams help visualize complex logic changes before implementing them in the codebase.
- During Documentation: Use activity diagrams to explain user workflows to non-technical stakeholders.
Building Your Skills Over Time 📚
Mastery of UML comes with practice. Start by sketching simple diagrams for your own projects. Draw a class diagram for a To-Do list application. Create a sequence diagram for the “Add Task” function. As you practice, the symbols will become second nature.
It is also beneficial to review diagrams created by others. When you open a repository or read a technical specification, look for the design documents. Compare the diagram to the actual code. Do the methods in the class diagram match the functions in the code? Do the relationships in the diagram reflect the actual dependencies in the project? This comparison bridges the gap between theory and practice.
Final Thoughts on Diagram Literacy 🎓
UML is not just a drawing tool; it is a communication language. Being fluent in this language allows you to participate in high-level architectural discussions and ensures that your code aligns with the intended design. By understanding the symbols, relationships, and flow, you reduce ambiguity and improve the quality of your software engineering work.
Keep this guide handy as a reference. When you encounter a new diagram type, refer back to the categories and symbols outlined here. With consistent practice, reading these diagrams will become as natural as reading code itself.

