


Cloud computing has fundamentally altered how we visualize and construct software infrastructure. Traditional deployment diagrams, once static representations of servers and cables, now require dynamic modeling to capture the fluid nature of cloud-native systems. When architects design for the cloud, they must account for elasticity, distributed regions, and ephemeral resources. This guide provides a detailed approach to optimizing deployment diagrams specifically for cloud environments.
Creating an effective diagram is not merely about drawing boxes; it is about communicating architectural intent, constraints, and flow. In a cloud context, a deployment diagram serves as the blueprint for infrastructure as code (IaC) and operational procedures. Below, we explore the necessary components, optimization strategies, and best practices to ensure your diagrams remain accurate and actionable.
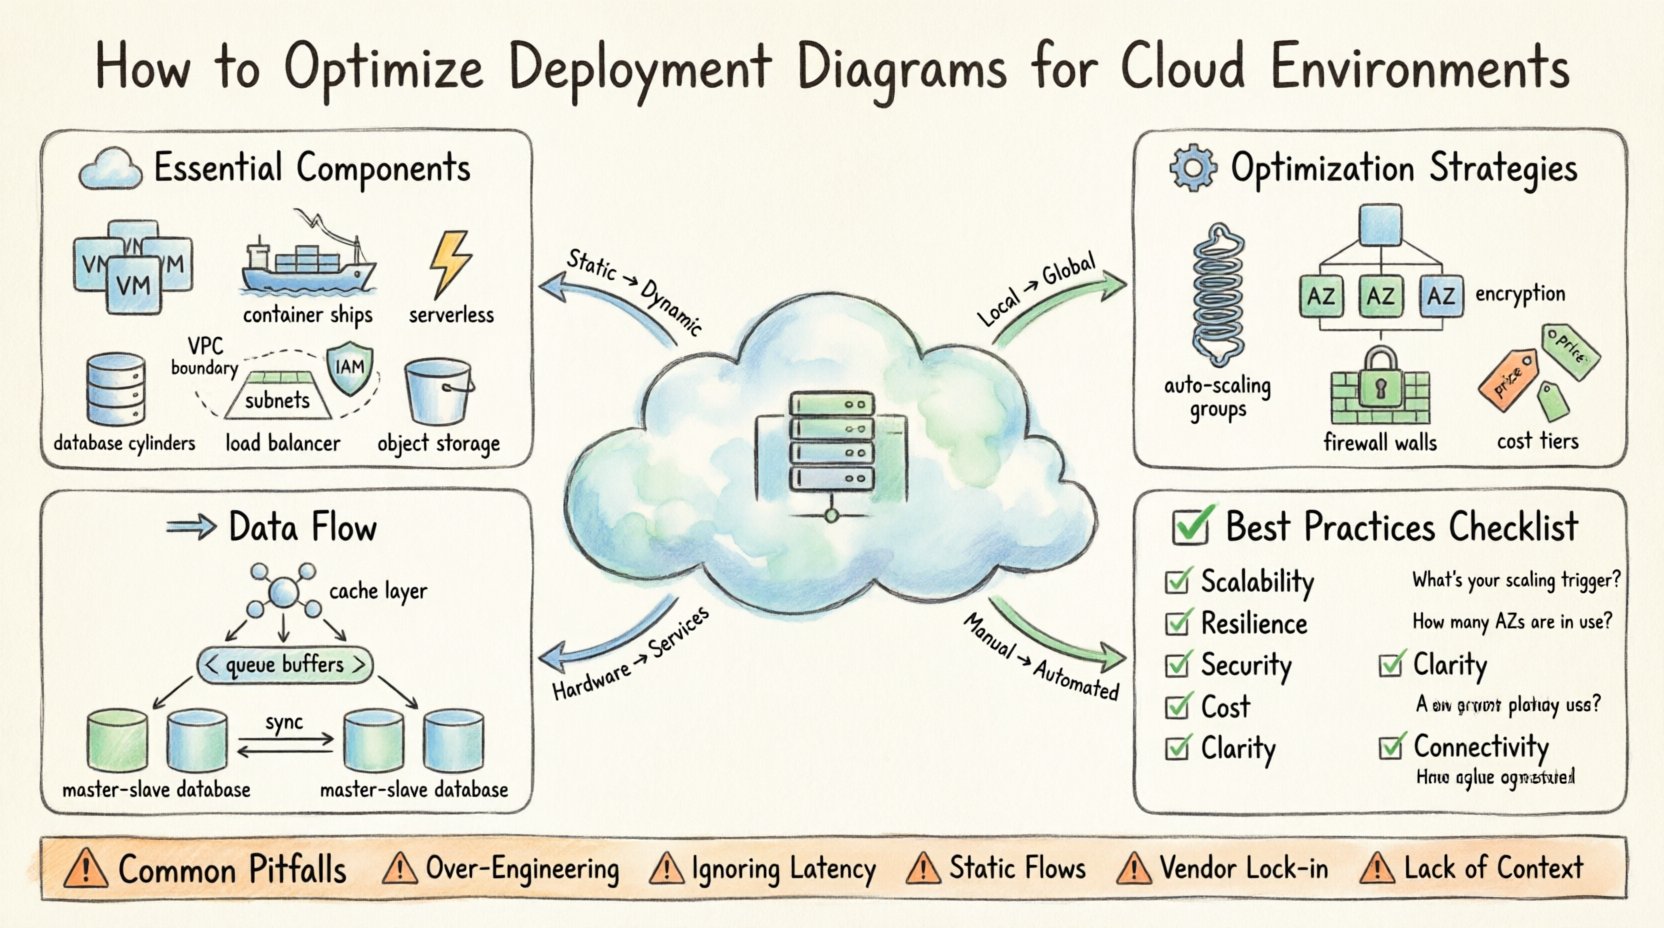
🏗️ Understanding the Cloud Shift in Deployment Modeling
On-premises infrastructure relied heavily on physical boundaries. A server was a physical box in a rack. In cloud environments, the server is often a virtual instance, a container, or even a function that spins up and down based on demand. Consequently, the deployment diagram must evolve to reflect these abstractions.
When optimizing for the cloud, consider the following shifts:
- From Static to Dynamic: Diagrams must show scaling capabilities, not just fixed nodes.
- From Local to Global: Connectivity spans regions and availability zones, introducing latency considerations.
- From Hardware to Services: Infrastructure is often abstracted into managed services rather than raw compute.
- From Manual to Automated: Deployment processes are driven by pipelines, which should be represented in the architecture.
Ignoring these shifts leads to diagrams that do not match the actual runtime environment. This discrepancy causes friction during implementation and debugging. By adhering to cloud-specific modeling standards, teams can reduce misconfiguration risks and improve deployment velocity.
📦 Essential Components of a Cloud Deployment Diagram
To optimize a diagram, you must first ensure all critical elements are present. A cloud deployment diagram differs from a standard UML deployment diagram by including cloud-specific nodes and connectors. The following components are essential for clarity and accuracy.
1. Compute Nodes
Compute is the engine of any application. In cloud environments, this takes various forms:
- Virtual Machines (VMs): General-purpose instances suitable for legacy lifts-and-shifts or stateful applications.
- Containers: Lightweight, portable units orchestrated by a cluster manager. These are ideal for microservices.
- Serverless Functions: Event-driven code execution where the provider manages the infrastructure entirely.
2. Storage Resources
Data persistence requires specific modeling. Storage is not just “disk space”; it is a service with tiers and access patterns.
- Block Storage: Attached directly to compute instances for high-speed read/write operations.
- Object Storage: Scalable storage for unstructured data, images, and backups.
- Managed Databases: Relational or NoSQL services that handle backups, patching, and scaling.
3. Networking Layers
Network topology dictates security and performance. Cloud networks are segmented logically.
- VPCs (Virtual Private Clouds): Logical isolation boundaries.
- Subnets: Segments within a VPC, often split into public and private tiers.
- Load Balancers: Distribute traffic across multiple targets to ensure availability.
- Gateways: Entry points for traffic entering the network from the internet.
4. Identity and Access Management (IAM)
Security boundaries are defined by who can do what. While often invisible in a purely technical diagram, IAM roles and policies are critical for deployment logic.
- Service Accounts: Identities used by applications to access other services.
- Roles: Permissions assigned to users or groups.
📊 Comparison of Deployment Patterns
Choosing the right pattern affects how the diagram looks and functions. The table below outlines common patterns and their visual representation characteristics.
| Pattern | Visual Representation | Best Use Case | Complexity Level |
|---|---|---|---|
| Monolithic | Single large box with internal layers | Small applications, legacy migration | Low |
| Microservices | Multiple small boxes connected via API | Scalable, independent teams | High |
| Serverless | Event triggers connected to function nodes | Intermittent workloads, backend logic | Medium |
| Hybrid | On-prem nodes linked to cloud nodes | Gradual migration, compliance needs | Very High |
⚙️ Optimization Strategies for Cloud Environments
Once the components are identified, the next step is optimization. An optimized diagram simplifies complexity without losing critical information. It guides the engineering team toward a resilient, cost-effective, and secure system.
1. Scalability and Elasticity
Cloud environments excel at scaling. Your diagram must reflect this capability. Static diagrams that show fixed numbers of servers are misleading.
- Auto-Scaling Groups: Represent these as a cluster node rather than individual machines. Indicate the minimum and maximum instance counts.
- Horizontal Scaling: Show how traffic flows to new instances. Use arrows to indicate the distribution mechanism.
- Vertical Scaling: If applicable, note resource limits (CPU/RAM) for instance types.
By visualizing scaling boundaries, stakeholders understand the system’s capacity to handle load spikes. This is crucial for capacity planning and budget forecasting.
2. Resilience and High Availability
Resilience is about surviving failures. A diagram should make the redundancy strategy obvious.
- Availability Zones (AZs): Draw distinct zones within a region. Show redundant paths across these zones.
- Multi-Region Deployments: For critical systems, depict active-active or active-passive relationships between regions.
- Failover Paths: Use dashed lines or specific colors to indicate backup routes that activate during primary failures.
When reviewing a diagram, ask: “If this node dies, does the system stop?” If the diagram does not show a failover path, the system is likely fragile.
3. Security and Segmentation
Security is often an afterthought in early diagrams. Optimize by embedding security controls directly into the visual model.
- Firewalls and Security Groups: Label the boundaries between public and private subnets.
- Encryption: Mark data flows that require encryption in transit (TLS) and at rest.
- Private Endpoints: Show connections that bypass the public internet to reduce exposure.
Clear security boundaries help auditors verify compliance and developers understand access constraints. Avoid placing sensitive data stores in public-facing segments in your diagram.
4. Cost Efficiency
Cloud costs can spiral if resources are not managed. While diagrams are not spreadsheets, they should reflect cost-aware architecture.
- Right-Sizing: Label instances with appropriate sizing categories (e.g., compute-optimized, memory-optimized).
- Spot Instances: Indicate where non-critical workloads can use variable pricing models.
- Storage Tiers: Differentiate between high-performance storage and archival storage in the diagram.
By visualizing these choices, teams can identify potential cost centers early in the design phase.
🔄 Data Management and Flow
Data flow is often the bottleneck in cloud architectures. Optimization requires clear visualization of how data moves between services.
1. Caching Strategies
Repeated data access can strain databases. Include cache layers in your diagram.
- In-Memory Caches: Place these close to compute nodes for low-latency access.
- Content Delivery Networks (CDN): Show edge nodes for static content distribution.
2. Asynchronous Processing
Not all tasks need to happen immediately. Use message queues to decouple services.
- Event Queues: Represent these as intermediate buffers between producers and consumers.
- Message Brokers: Indicate the system handling the routing of messages.
This decoupling improves resilience. If a consumer is down, messages wait in the queue rather than failing the request.
3. Database Replication
Data consistency is vital. Show how data is synchronized.
- Master-Slave Replication: Clearly distinguish read-only replicas from the primary writer.
- Sharding: If data is split across multiple nodes, indicate the sharding key or logic.
🛠️ Best Practices for Diagram Maintenance
A deployment diagram is a living document. It must evolve as the system changes. An outdated diagram is worse than no diagram, as it leads to incorrect assumptions.
1. Version Control
Store diagram files in the same repository as the infrastructure code. This ensures that changes to the code trigger updates to the diagrams.
- Commit Messages: Reference the diagram file when updating infrastructure.
- History Tracking: Use version control to revert changes if a new design proves problematic.
2. Automated Generation
Where possible, generate diagrams from code. Infrastructure as Code (IaC) templates (like Terraform or CloudFormation) can be parsed to render visual maps.
- Consistency: Eliminates the gap between the code and the diagram.
- Accuracy: The diagram always reflects the deployed state.
3. Review Cycles
Schedule regular reviews with the architecture team. Ensure that the diagram matches the current operational reality.
- Quarterly Audits: Verify that all regions, zones, and services are documented.
- Post-Incident Updates: After a production issue, update the diagram if the root cause involved a structural change.
📋 Optimization Checklist
Use this checklist before finalizing any cloud deployment diagram. It ensures that critical aspects are covered and optimized.
| Check | Question to Ask | Impact |
|---|---|---|
| Scalability | Are auto-scaling groups clearly defined? | Performance under load |
| Resilience | Is there redundancy in critical paths? | Uptime and disaster recovery |
| Security | Are network boundaries and encryption marked? | Compliance and data protection |
| Cost | Are storage tiers and instance types labeled? | Budget control |
| Clarity | Can a new engineer understand the flow in 5 minutes? | Onboarding speed |
| Connectivity | Are API gateways and load balancers shown? | Traffic management |
🔍 Common Pitfalls to Avoid
Even experienced architects make mistakes when modeling cloud environments. Recognizing these pitfalls helps refine the diagram quality.
- Over-Engineering: Do not model every single server in a fleet. Use aggregate nodes to represent groups of identical resources.
- Ignoring Latency: Do not draw lines between regions without indicating the network delay. This affects user experience design.
- Static Data Flows: Avoid showing only happy paths. Indicate error handling and retry logic where visible.
- Vendor Lock-in Notation: While you should avoid naming specific products, indicate if a service is proprietary or open-standard to inform future migration strategies.
- Lack of Context: Do not draw the system in isolation. Show where the user, the client application, and external APIs connect.
🚦 Conclusion
Optimizing deployment diagrams for cloud environments is a continuous process that balances technical accuracy with visual clarity. By focusing on scalability, resilience, security, and cost, architects can create blueprints that guide successful implementation. The goal is not to create a perfect picture, but a functional map that enables teams to build, operate, and evolve infrastructure with confidence.
Regular maintenance and adherence to best practices ensure that the diagram remains a valuable asset throughout the software lifecycle. As cloud technologies evolve, so too must the diagrams that describe them. Stay agile, keep the documentation current, and prioritize clarity over complexity.

