


In the world of software development and system design, clear communication is the foundation of success. When teams move from abstract ideas to concrete code, they need a shared language to bridge the gap between business requirements and technical implementation. This is where Unified Modeling Language, commonly known as UML, comes into play. It serves as a standardized visual way to describe, specify, construct, and document the artifacts of software systems. 🏗️
Understanding UML is not about memorizing symbols; it is about understanding the relationships between components and how data flows through a system. Whether you are a project manager, a developer, or a system architect, grasping the concepts behind this modeling language can significantly improve the clarity of your projects. This guide explores the fundamentals, the types of diagrams, and practical applications without getting bogged down in jargon.
🔍 What Exactly Is UML?
UML stands for Unified Modeling Language. It is a general-purpose modeling language in the field of software engineering that is designed to provide a standard way to visualize the design of a system. It was originally designed to standardize the notations used by object-oriented analysis and design. Today, it is widely used for specifying, visualizing, constructing, and documenting the artifacts of software systems.
Key characteristics of UML include:
- Standardization: It is managed by the Object Management Group (OMG), ensuring consistency across different tools and organizations.
- Visual Representation: It uses graphical notations to represent system elements, making complex logic easier to understand.
- Platform Independence: The diagrams describe the system logic, not the code itself, meaning they are not tied to a specific programming language.
- Comprehensive: It covers both structural and behavioral aspects of a system.
Think of UML as a blueprint for a building. Just as architects use blueprints to show electricians where wires go and plumbers where pipes run, software engineers use UML diagrams to show developers where data flows and how components interact. 🏛️
📜 A Brief History of the Language
UML was not created overnight. It emerged in the 1990s during a time when software engineering faced a crisis of complexity. Different object-oriented methods were using different notations, making collaboration difficult. Three key figures, often called the “Three Amigos,” worked to unify these methods:
- Grady Booch: Known for his work on object-oriented software development and design.
- Ivar Jacobson: Creator of the Object-Oriented Software Engineering (OOSE) method and use cases.
- James Rumbaugh: Creator of the Object Modeling Technique (OMT).
These three combined their methods in 1994, leading to the Rational Unified Process. By 1997, UML 1.0 was accepted as a standard by the OMG. Since then, it has undergone several revisions (UML 1.3, 1.4, 1.5, 2.0, 2.1, 2.2, 2.3, 2.4, 2.5) to accommodate evolving needs in software architecture and cloud computing. 🔄
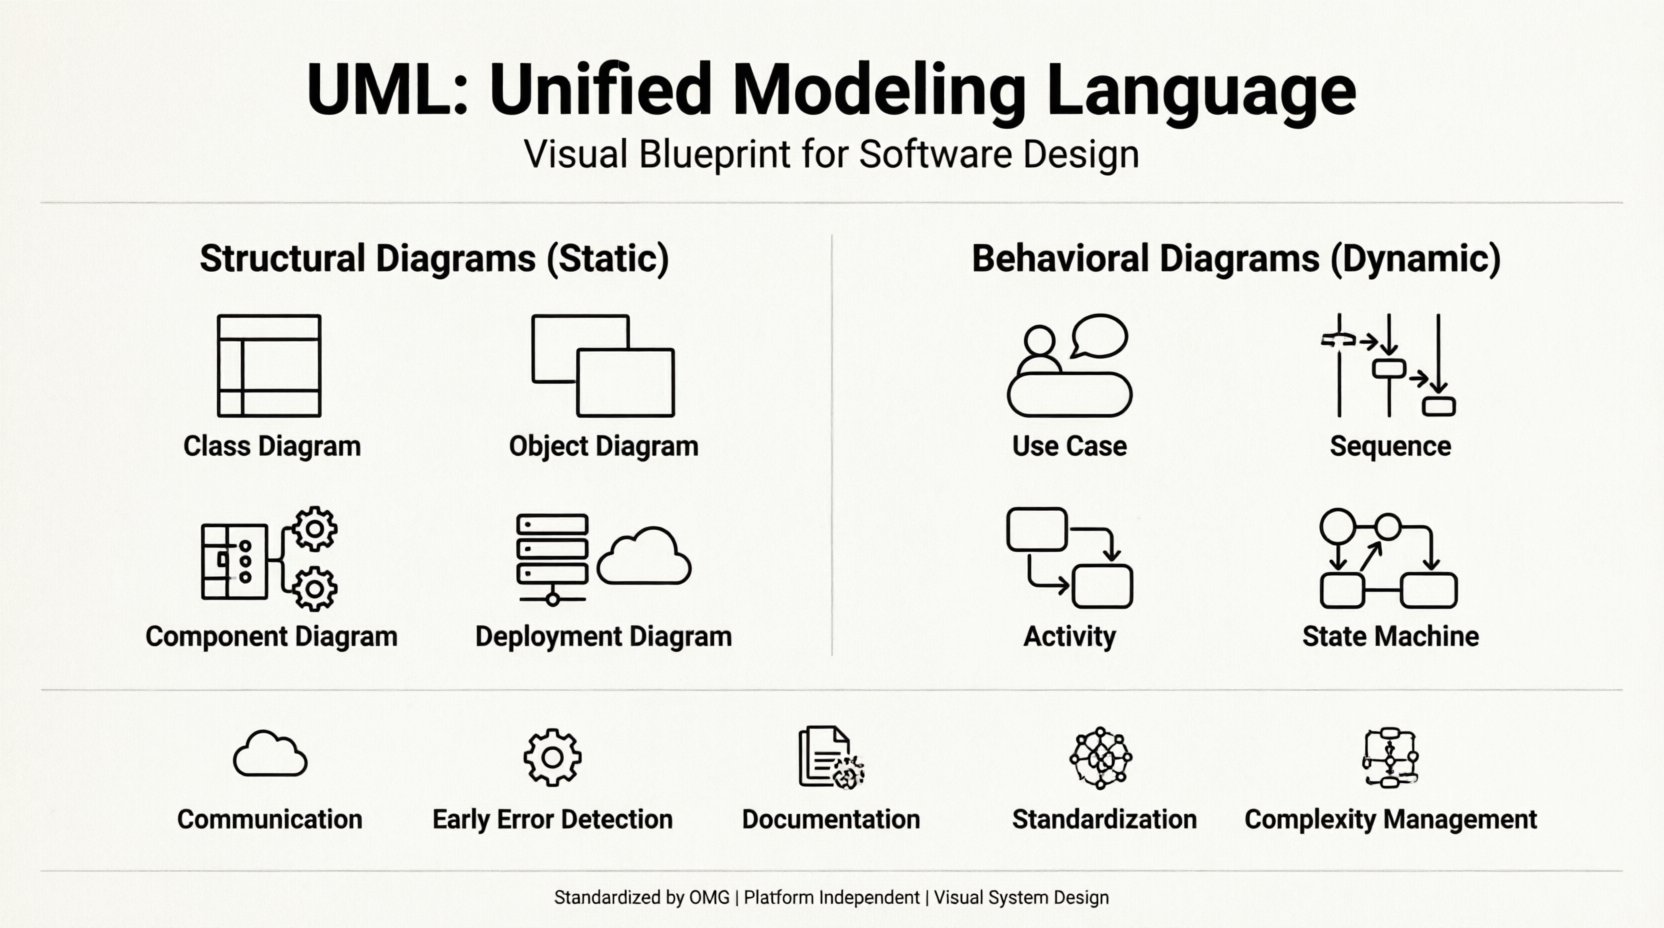
🧩 The Two Main Categories of UML Diagrams
UML diagrams are broadly categorized into two types: Structural Diagrams and Behavioral Diagrams. Structural diagrams show the static aspects of the system, such as classes and objects. Behavioral diagrams show the dynamic aspects, such as interactions and state changes. 🧠
Below is a structured overview of the diagram types:
| Category | Diagram Type | Primary Purpose |
|---|---|---|
| Structural | Class Diagram | Shows static structure and relationships. |
| Structural | Object Diagram | Shows instances of classes at a specific time. |
| Structural | Component Diagram | Shows organization of physical components. |
| Structural | Deployment Diagram | Shows hardware topology and software deployment. |
| Structural | Package Diagram | Organizes elements into groups. |
| Structural | Composite Structure Diagram | Shows internal structure of a class. |
| Behavioral | Use Case Diagram | Shows interactions between actors and the system. |
| Behavioral | Sequence Diagram | Shows object interactions over time. |
| Behavioral | Activity Diagram | Shows workflow and logic flow. |
| Behavioral | State Machine Diagram | Shows states and transitions of an object. |
| Behavioral | Communication Diagram | Shows object interactions and links. |
| Behavioral | Timing Diagram | Shows changes of state over time. |
| Behavioral | Interaction Overview Diagram | Combines activity and interaction diagrams. |
While there are many diagram types, not every project requires all of them. The most commonly used diagrams in daily development are the Class, Use Case, Sequence, and Activity diagrams. 🛠️
🏗️ Deep Dive into Structural Diagrams
Structural diagrams focus on the architecture of the system. They define the static parts of the model, such as classes, objects, components, and nodes. These diagrams answer the question: “What does the system look like?”
1. Class Diagram 🏛️
This is the most widely used diagram in UML. It shows the system’s classes, their attributes, operations (methods), and the relationships among objects. It is the backbone of object-oriented design.
- Class Box: Divided into three sections: Class Name, Attributes, and Operations.
- Relationships: Includes associations, inheritances (generalization), and aggregations.
- Usage: Used during the design phase to plan the database schema and code structure.
2. Object Diagram 🖼️
An object diagram is a snapshot of a system at a particular point in time. It shows the state of objects and their links. While a class diagram defines the template, an object diagram defines the actual data.
- Instance Names: Objects are often named with an underline (e.g., customer1).
- Links: Shows the actual connections between instances.
- Usage: Helpful for debugging and verifying class diagrams.
3. Component Diagram 🔌
This diagram describes the organization and relationships of software components. It represents the physical implementation of the system, such as libraries, executable files, and frameworks.
- Components: Represented by a rectangle with two smaller rectangles on the top left.
- Interfaces: Shows how components interact with each other (provided or required).
- Usage: Useful for large-scale systems where modularity is key.
4. Deployment Diagram 🌐
A deployment diagram shows the physical hardware used in the implementation of the software. It depicts nodes (hardware) and the artifacts deployed on them.
- Nodes: Represent computers, servers, or devices.
- Artifacts: Represent the software files running on the nodes.
- Communication: Shows network connections between nodes.
🔄 Deep Dive into Behavioral Diagrams
Behavioral diagrams describe the dynamic aspects of the system. They focus on how the system behaves over time and how it reacts to external events. These diagrams answer the question: “How does the system work?”
1. Use Case Diagram 🎯
Use case diagrams capture the functional requirements of a system. They show the interactions between “actors” (users or external systems) and the system itself.
- Actors: Represented by stick figures. Can be human users or other software systems.
- Use Cases: Represented by ovals. Describe a specific function or service provided by the system.
- Relationships: Shows which actors participate in which use cases.
2. Sequence Diagram 📅
Sequence diagrams show how objects interact with each other over time. They are crucial for understanding the flow of messages between components.
- Vertical Axis: Represents time flowing downwards.
- Horizontal Axis: Represents different objects or participants.
- Messages: Arrows between objects indicating calls or responses.
3. Activity Diagram ⚙️
Activity diagrams are similar to flowcharts. They show the flow of control from activity to activity. They are often used to model business processes or algorithms.
- Nodes: Represent actions or states.
- Edges: Represent the flow of control between nodes.
- Decision Points: Diamond shapes indicating conditional logic.
4. State Machine Diagram 🔋
State machine diagrams describe the life cycle of an object. They show the states an object can be in and the transitions between them.
- States: Represented by rounded rectangles.
- Transitions: Arrows showing how an object moves from one state to another.
- Events: Triggers that cause the transition.
✅ Benefits of Using UML
Adopting UML in a development workflow offers several tangible advantages. It is not just about drawing pictures; it is about improving the quality of the software and the efficiency of the team.
- Improved Communication: Provides a common visual language for developers, analysts, and stakeholders. Everyone looks at the same blueprint. 🗣️
- Early Error Detection: Issues in logic or architecture can be spotted during the design phase, before code is written. This saves time and resources.
- Documentation: UML diagrams serve as living documentation. They explain the system to new team members or for future maintenance.
- Standardization: Since UML is a standard, developers can switch tools without losing the meaning of the diagrams.
- Complexity Management: Large systems are hard to visualize. UML breaks them down into manageable parts.
⚠️ Common Mistakes to Avoid
Even with a powerful tool like UML, teams often make errors that reduce its effectiveness. Being aware of these pitfalls helps in maintaining high-quality models.
- Over-Modeling: Creating too many diagrams for small projects can slow down development. Use UML where it adds value.
- Lack of Updates: Diagrams must be updated as the code changes. Outdated diagrams are worse than no diagrams at all.
- Ignoring Notation Rules: Using symbols incorrectly can lead to confusion. Stick to the standard UML notation.
- Too Much Detail: Diagrams should be readable. Avoid cluttering a single diagram with every variable and method.
- Assuming Code Equals Diagram: The diagram is a model. Sometimes the implementation deviates, and sometimes the model guides the implementation. Do not treat them as identical.
🛠️ Implementing UML in Your Workflow
Integrating UML into a project requires planning. Here is a general approach to getting started:
- Define the Scope: Determine which parts of the system need modeling. Start with high-level requirements.
- Choose the Right Tools: Select modeling software that supports the UML standards. Many modern tools offer code generation and reverse engineering capabilities.
- Train the Team: Ensure all team members understand the notation. A shared understanding is critical.
- Iterate: Treat the diagrams as drafts. Refine them as the project evolves.
- Link to Code: Where possible, link diagrams to code artifacts to ensure consistency.
🚀 Is UML Still Relevant?
In an era of agile development and rapid prototyping, some question the value of detailed modeling. However, UML remains relevant for several reasons. Complex systems, distributed architectures, and enterprise-level applications still require rigorous planning. While lightweight documentation is preferred for small startups, large organizations benefit from the discipline UML enforces. 📊
Furthermore, modern tools have evolved. UML is no longer just static images; it is often integrated into Model-Driven Architecture (MDA) and can drive code generation directly. This integration ensures that the visual model remains the source of truth for the system.
🔑 Key Takeaways
Unified Modeling Language is a vital tool for software engineering. It provides a structured way to communicate complex ideas visually. By understanding the difference between structural and behavioral diagrams, teams can design systems that are robust and maintainable. Whether you are planning a small application or a massive enterprise system, UML offers a framework to bring clarity to chaos.
Remember that the goal is not to create perfect diagrams, but to facilitate better understanding. Start simple, focus on the most critical interactions, and let the diagrams guide your development process. With practice, these visual languages become second nature, helping you build software with confidence. 🚀

